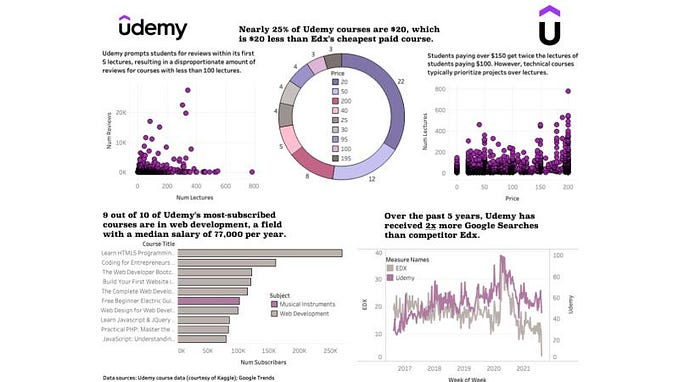
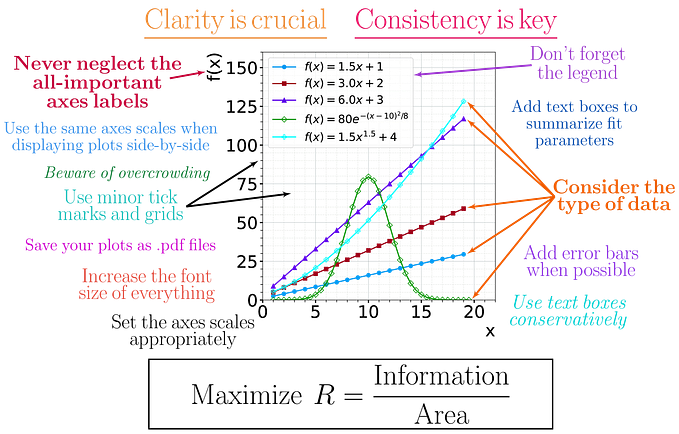
Many people lurk and admire data visualizer content on Twitter, LinkedIn, and even Reddit, but don’t leap to level up their own portfolio. There are so many reasons you should (without delay) and here are 7 of mine. I consider this more of a continuation of Avinash Reddy Munnangi’s (Twitter | Tableau Public) great post on VizArtPandey. If you are unfamiliar with Tableau Public or need a quick overview, please check his article out.

At Keyrus US’ next internal TUG, I will be talking about our Tableau Public site (more content coming soon) and Tableau Public in general. It pushed me into a rabbit hole of good that is Tableau Public and made me consider some of the things I did to improve my portfolio without really considering it.
1. Viz what you love
Tableau Zen Master, Zach Bowders (Twitter | Tableau Public | Podcast), wrote it best in Nightingale when he detailed vizzing what you love. Utilizing your passion, you often have to create/curate your own data set — it also pushes you to create something unique and powerful. We all have topics that are pet topics. You can viz like Zach and I and cover lighter topics relating to pop culture and entertainment or create powerful stories like Soha Elghany (Twitter | Tableau Public). There is room for many types of interests as long as you are respectful of others.
2. Participate in Community Initiatives
You may have difficulty considering what to viz about. Every creative I know has viz block. Our #datafam has your back. There are many initiatives with a ton of participation with data outlined. I’ll share some of the main ones and break down their ease to follow, frequency, and complexity.
- #MakeoverMonday is the premium design project for ease of use, activity, and frequency. There are years of cleaned and simple datasets published weekly. In addition, there are hundreds of participants each week and old data sets are organized well if you want to work on specific types of data. The data can come from anywhere. You have a base visualization that can use a makeover due to its design. Zen Master HOF Andy Kriebel (Twitter | Site) shares his viz process weekly and viz reviews are also shared.
- Workout Wednesday provides a weekly viz puzzle to solve. Participating in this will not help your viz thought process while re-engineering a viz, but help you learn skills; it’s especially useful when new Tableau releases launch to help wrap your head around the feature(s). I would consider the complexity from intermediate to very challenging.
- There are many monthly initiatives and here’s a summary of those (unranked)…
- Topics: Various
- Complexity: Open
Notes: You get to prepare your own data, has an extensive recap and blog, and an active social media presence
- Topic: Sports
- Complexity: Intermediate to Advanced
Notes: It has its own website, includes prepped data sets, a monthly wrap up, and is active on social media
- Topics: Equity, Awareness, Diversity
- Complexity: Beginner to Advanced
Notes: Included prepped data sets and is active on social media
- Topic: Health/health care
- Complexity: Intermediate to Advanced
Notes: Site, prepped data sets, blog, and active on social media
- Topic: Sustainable Development Goals
- Complexity: Intermediate to Advanced
Notes: It has a website, includes prepped data sets, a blog/review, and is active on social media
- Topic: Education
- Complexity: Open
Notes: It’s has its own website, you prepare your own data, it blogs, recaps, and is active on social media
Real World Fake Data (Retired)
- Topic: Business
- Complexity: Intermediate to Advanced
Notes: It’s on a blog, contains prepped data sets, a blog, and active on social media
- Topic: Non-profit
- Complexity: Beginner to Advanced
Notes: The project is tool agnostic, has a website, contains prepped data sets, provides recaps, and is active on social media
- Topic: Various
- Complexity: Open
Notes: The project is tool agnostic, has a website, contains prepped data sets, provides recaps and extensive reviews, and is active on social media
For more on community projects, please check out the expanding list here!
3. Share on Twitter or LinkedIn
What’s next? You create magic and want to share. Although you may get a couple of looks if inactive in social media, there are so many Tableau Public users that it will have a difficult time catching eyes. To snag glances, you need to be active on social media. If you don’t have a data-centric Twitter account or active with the community on LinkedIn, here’s a zen-sational resource prepared by Kevin Flerlage (Twitter | Site).
Briefly, if you are an active contributor in the community, support others, you won’t believe how quickly sincere engagement follows.
4. Accept and Learn from Feedback
Getting told there is something that doesn’t work on your viz is hard to see or hear. When sharing a visualization on social media, and your goal is to improve the visualization, it’s super important to request feedback. You can ask for feedback in the post’s thread or request it via a direct message.
My experience relates that sharing feedback privately in a direct message allows for a stronger understanding of direction and lowers the feeling of being attacked/embarrassed. In a direct message, a person has more space to contextualize feedback. Please note that people in our community usually do not share feedback to put others down or elevate themselves; they really want to help.
You can also ask for feedback from people before you share a viz on Social Media. The easiest way to do this is to publish your viz to Tableau Public, hide the viz, and share the link with the person who agreed to provide feedback. Please note that you should always ask if someone is available before requesting feedback as a common courtesy.
When someone takes time to provide feedback you implement, it’s showing appreciation of their time if you tag them and thank them for the feedback in your shared post. The exception is if they ask you not to do that.
If you don’t feel comfortable asking or are not getting the feedback you need, one initiative that has you covered is Viz Feedback Office Hours led by Tableau Ambassadors Michelle Frayman (Twitter | Tableau Public) and Zak Geis (Twitter | Site). Please complete this form if you want to be part of this fantastic offering.
5. Cite Inspiration
Although the community is super charitable and giving and Tableau Public allows you to download visualizations (if a publisher permits it), not giving credit to a creator when your work is inspired by theirs is very poor form. We all see a viz and find it as a source to create a chart, color palette, or style and may apply a bit of that to our own work; to not give credit to the muse that elevated ‘the possible’ of your work can be seen as borderline thievery or at least questionable ethically. When sharing on social media and on the viz itself, the source or sources need to be identified. Crediting those influencers only helps you earn the trust of people in our community and will elevate your profile.
However, it’s a completely different story if the visualization is copied and published to your profile. Downloading or making a copy of someone else’s viz and using that to publish to your profile is theft if visible and even more concerning if shared as yours on Social Media. If the intent is to simply learn from the viz, you can select it as a favorite and go to it as needed.
If for some reason you copy it and put it on your profile, hide it so others don’t see it as you claiming it’s your work. See the image below to see the visibility toggle for a viz.

To test, go to your profile and check what others see as shown in the image below…

6. Collaborate
The best way to learn deeply is to work with others. Many people in our community love to collaborate. I’ve collaborated a lot and covered it in great detail here (with Kevin Flerlage), here (with Brian Moore (Twitter |Tableau Public)), and here (with Zach Bowders) — I’ve learned that coming in with a common goal and no ego only elevates your viz game while strengthening your friendship with your partner. In addition, the viz created usually is greater than either of you can build on your own.
7. Share Your Knowledge
The #DataFam is vested in your process and progress. Sure there are many blogs, YouTube channels, TUG speakers, and so on. Creating a resource to draw from is great for you to see your own growth, but super helpful to those that will follow you and gain influence from you.
It’s also super helpful to share your errors, hurdles, and false starts. Remember when you saw the work of others and became intimidated; think of how helpful it would have been for you to see their missteps along the way to provide a little comfort that there is a process and failing but moving forward to overcome those issues is far more inspirational than seeing the ‘magic’ up a finished product.
A couple of parting tips
- Consistency will expedite your growth and following. When beginning, commit to publishing a viz regularly. A reasonable goal is weekly. Once you get comfortable, find your viz voice, and want to pursue more challenging visualization (like the monthly challenges)… slowing down is fine, but try to share something monthly so your fans will keep engaged. Obviously, life events happen — this tip excludes that factor.
- Don’t make your main purpose to be a Tableau Public Featured Author, a Viz of the Day recipient, a Tableau Ambassador, or Zen Master or recruited to get a job as a data viz consultant/designer. These are great goals to have in the background but are harmful to make that a primary motivation and will impact your desire to participate whether these things happen or don’t. Instead, think of how you can best contribute to the community. Doing that will only elevate you, your work, and make those rewards so much more impactful when they happen. When I began with the community, I had a background goal of being an ambassador but didn’t think or expect it to happen in years. I never thought it would happen in a little over a year (along with so many incredible honors that came my way). My primary motivation was to learn to improve as a designer and give back because I loved Tableau and wanted to be part of something more than me. Even though I had a couple of disappointments, overall, everything I got from Tableau since then felt like otherworldly and unexpected wins — it has changed my life both personally and professionally. You need to let yourself go a little bit to allow for the glory of recognition.
Editor’s Note: Although we haven’t done #datafam interviews in a little while, I plan to resume them in time, but balanced with more diverse content as learning and teaching with my new role at work has re-sparked my passion to contribute in additional ways. As for visualizations, nearly all of my visualizations for the foreseeable future will be new or enhanced shares on Keyrus’ Tableau Public page. There are many updates planned shortly, so please give that page a follow to see us on your activity feed.
Adam Mico
Twitter | LinkedIn | Tableau Public | Keyrus’ Tableau Public

