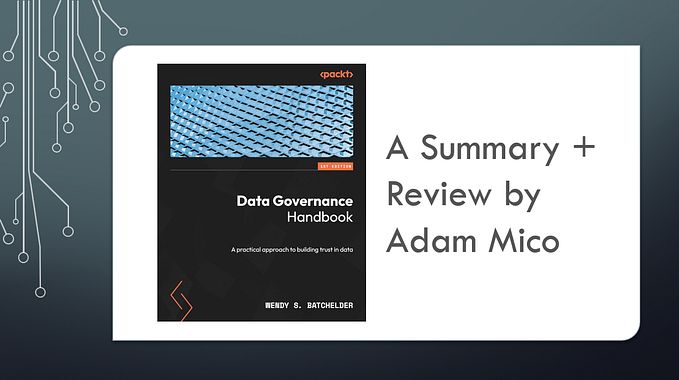
Data Viz Thoughts .|: UK & I Virtual TUG/Advent Calendar & Brian Moore + I Break Down ‘The Sandberg Game’ Viz
A Tableau-centric weekly blog about the viz making process, #datafam member interviews, Viz of the Week, entertainment for introverts (consisting of a music morsel & a binge bite).

This week, I will be reflecting on the UK and Ireland Virtual TUG presentation from 12/19, my inclusion in the Advent Calendar and best yet… Brian Moore (@BMooreWasTaken)’s collaboration with me on The Sandberg Game viz released earlier in the week!
UK & Ireland Virtual TUG
On 12/19, I had a wonderful opportunity to present my community story for the UK and Ireland Virtual TUG. Caroline Yam (1), the facilitator with Tableau asked me in a convo leading up to this whether I was nervous to share live with hundreds of people looking and the session being recorded for Tableau’s YouTube — I told her I wasn’t.
Usually, when speaking in public or even speaking with a person one on one, I’m very nervous. The difference is I shared so much of myself with the community and it’s the 1st time in my life, I genuinely feel that the data validation is there to support this audience is not looking for me to slip-up — everyone watching wants me to do well and I know it’s important to represent the community that has given me so much.
Although I’m usually alert at 5AM, I rarely say more than a couple words until 7:30AM…. but creating my PowerPoint + a lesson plan and going over it a number of times prepared me. After the presentation, I had a ton of positive support and felt connected on a deeper level with more community members — that bit gave me a lot of joy . Through the good vibes, I did get a couple of interesting direct message comments which made me ponder some things…
Zach Bowders (@ZachBowders) (2) mentioned that he could tell I was a bit choked up when describing the Vizzie Awards (listening to the replay of its posting on YouTube when people were excited that I had won ‘Notable Newbie’ and also learning of my ‘Best Blog’ nomination)— this was something I was unaware of when presenting.
Being an aspie, I may come off as ‘normal’ due to years of monitoring what ‘people usually do in (fill in the blank) situation’, but recognizing emotions of mine or of others is very difficult. I know when I found out about the vizzie and blogged about it, I was overwhelmed with gratitude because I have been looking for a community to belong to for nearly 45 years and this is the 1st time I felt I belonged anywhere — a massive burden was lifted instantaneously (aspies are a little different… but always want to belong somewhere). Logically, returning to that moment would cause that ‘choking up’.
Kevin Flerlage (@FlerlageKev) mentioned that I come off as very likeable and a personality that’s easy to gravitate to. In my normal life, I’m a loner and tend to try to blend in when I can’t be (and escape to solitude as soon as there’s an opening). Some people enjoy my company when we have shared interests or I crack a couple of quick jokes, but if I cannot identify with someone… it’s hard for me to come off as anything but a helpful/capable rock (but not a fun pet one). It says a lot a bout the community’s impact to extract so much from a person who’s customarily a blank/expressionless slate.
Advent Calendar

Within a couple hours of the presentation and after Sarah Bartlett (@sarahlovesdata) also honored my by sharing a special shout-out of me with others in her year-end wrap-up at the Virtual TUG, Matt Francis (@Matt_Francis) announced me as entry in the the Tableau Wannabe Advent Calendar — this calendar is filled with so many people I admire greatly and being one of those considered in this mix of data heroes isn’t really quantifiable to me. Please check it out and follow/study the other members of this calendar as they are sensational humans, excellent community organizers, teachers/mentors and exceptional data visualizers.
The Take Away…
I’m not the best at anything and was pretty much a shelled hermit crab until Tableau Magicians found me in July and introduced me to the datafam. If someone like me can make an impact with such a remarkable group, you will also have success here if you have a desire to contribute and collaborate.
The Sandberg Game Viz Collaboration

(My) Historical Background…
As a semi-isolated nine-year-old boy, I found solace with a new love… sports. I particularly loved the Chicago Cubs and their broadcaster, Harry Caray. Leading up to that time, I had the good fortune of living in the area and the Chicago Cubs station, WGN was a local television station (this preceded wide availability of cable and satellite TV). Harry was basically an old loud and silly kid (just add Budweiser) and made baseball fun to watch even if the game was dull because when he went on tangents, you never know where they would end up!
On 6/23/1984 (five days before my 9th birthday), I had a new baseball hero and understood how a game like baseball is addictive. I was listening to the radio feed and watching on TV at home. Harry was annoyed the game was nationally televised and was stuck on the radio for the broadcast’s duration. Harry was increasingly irritable as the Cubs were getting bludgeoned 9–3. I was happy to leave the house, so we went to the mall (remember this was the 1980s) and tried to get game out of my head until I walked by a store and the score was 9–8 with the Cardinals having two outs during their batting frame in the 9th. After an easy out, it was the Cubs at bat. I was allowed to stay and watch until the end of the 9th inning.
We were facing the best closer in the game (Bruce Sutter) and Ryne “Ryno” Sandberg, a young Cubs prospect… somehow homered, to tie the game! The inning ended without a score and I was pulled away from the game, but listening at another store and although the Cubs gave up a couple of runs in the 10th inning, Ryno went up against Sutter. As soon as I heard he was on deck, I begged to watch at the store and was given permission… he slugged one again. It was so incredible — nobody could believe it! I listened to the rest of the game and somehow we inched out a walk-off win in the next inning.
This game changed me from just another fan to a superfan! Later in the year, I got to watch my 1st Cubs game at Wrigley (and they beat the Phillies). This was the year they stopped being a laughing stock and won the NL East (and all was great until they choked against the Padres in the playoffs). He was and remained my favorite sports star through the next 35 years.
In 2016, my wife and I went to a Cubs game and sat a couple rows behind him. I passed him once and got the courage to take a picture with Ryno (with a shout-out to the photo-bomber).

The Viz
A few months ago, I downloaded and cleaned the events of the entire game from baseball-reference.com in Excel. I held onto it because it could make a great visualization celebrating this incredible event, but knew it needed to be made with someone. I’ve studied Brian Moore’s amazing work on his Tableau Public profile; his sports vizzes are the most remarkable I’ve seen of that type. He was my dream (…only choice) to make this viz a reality.
I DM’d him about the idea, he was excited and was shocked he had never collaborated before. We talked through the data and my idea was racing in his mind — he was all-in and excited to put this together in a viz. Brian had a ton going on, but with any disposable and loosely disposable time, he challenged himself and extended the viz-ion more than I could have ever considered possible.
Brian Moore (3): Going into this viz we (and by we, I mean mostly Adam), had 4 main ideas that we wanted to incorporate into the dashboard. First, since we had play by play data, we wanted to build out an interactive dashboard that would let users relive this epic game by “stepping” through each batter and visualizing the results. Second, we wanted to highlight the changes in win probability throughout, as the Cubs spent most of the game at less than 5%. Third, we wanted to incorporate some sort of interactive baseball field. And finally, we wanted a live scoreboard. And although the design may have changed a few times throughout the process, we managed to stick to these pretty well.
After coming up with the general elements we wanted in our dashboard, we started discussing possible designs. Since this was kind of a throw-back we came up with the idea of designing the dashboard so that it looked like a vintage newspaper, which Adam appropriately dubbed the “Tableau Times”. Here are some of our early “sketches”.

We were all-in on the newspaper idea, but a few weeks in we hit a bit of a speed bump. For the week 48 Makeover Monday, a few different people had created amazing vizzes… but all with a newspaper background. Although we certainly didn’t “borrow” the idea, we didn’t want to publish another dashboard with that type of design just a week or so later. So we pivoted.
To counter the newspaper foil, Adam was able to take the image below and create this really cool background with a nice smoky affect.

Not using the newspaper layout also gave us a little more flexibility on the dashboard size and overall layout. Because it was going to be interactive and each viz would update with each “step”, we wanted to make sure that the entire dashboard fit on one screen without scrolling. The new background allowed us to go “wide” and better fit all of our different elements. So we had our new design, and a few days later, another speed bump. Jeff Plattner (@JtothaVizzo) published an incredible viz with our #datafam Community Pick-em league results (4)…with a really cool smoky background. Finally we decided to go with a plain background and use some lines and thick borders to fill some of the white space and to add a little more style to the dashboard.
As we were going through all of these design changes, we were busy building out all of the different elements of the dashboard. We wanted the probability chart to be the focal point of the dashboard, as we both agreed it was the most intriguing aspect of our project… everybody loves a comeback.
There are several ways we (5) could have visualized this data, but we wanted something that was unique, and that would really stand out. We decided to go with a diverging area chart to show each team’s probabilities, and then used Ken Flerlage’s incredible technique for adding colored gradients. For more info on how to do this, check out Ken’s blog here. Hopefully at some point this type of functionality will be available natively in Tableau, but in the meantime, here’s a little breakdown of how it works. This chart is actually 6 worksheets, in 3 floating horizontal containers, stacked on top of each other.

Next, we got to working on the interactive baseball field, which had a few different elements we wanted to blend together; the movement of the batter and any baserunners, text descriptions of the movement, text description of the play result, and the location of the hit. Again, we ended up stacking several different types of charts on top of each other to get the desired effect. Unlike the other chart, this would require some manipulation to our data set. For the hit locations, we wanted to use polygons to “highlight” that portion of the field. To do that we used the amazing Interworks Drawing Tool which can be found here. Also, the source data only had one record per play, but we needed additional records so we could display each baserunner, as well as their movement. So for each baserunner, including the batter, we needed two records for each play, one for their start position, and another for their end position (additional records needed for players that rounded multiple bases). Unfortunately, adding the records was a somewhat manual process, but we were able to use some pretty simple calculations to calculate all of the x and y coordinates. And finally, we wanted to show lines connecting the baserunner to a text description of their movement, which required an additional data source containing 3 to 4 records for each base that we then joined to our data set.
Once we had the data in the format we needed, we got to work on building out each of the layers. There were 6 layers in total stacked on top of an image of a baseball field that we modified to fit our dashboard design using PowerPoint.

This section of the dashboard also used about 40 different custom shapes that were created in PowerPoint, and assigned using a combination of the following; the team, the result of the play, the direction the player is heading, the position (start, end, base), and whether or not the player was the batter or a baserunner.

The next element we built out was the scoreboard, which had only a single layer, but required more data manipulation than any of the other vizzes. In this case, we needed a row for every digit on the scoreboard, for every record in the data set (9 rows for inning scores, 2 for total scores, 2 for hits, 1 for errors, 2 for batter, etc. for each of the 116 batters). For this viz we used 4 custom shapes that were built in PowerPoint; on-down, on-across, off-down, and off-across.

Each number on the scoreboard is a scatterplot, made up of 7 points. We leveraged a second sheet for this data source that contained a field with numbers 0 through 9, and 7 records for each number, 1 for each point in the scatterplot, for a total of 70 rows. This sheet contained the X and Y coordinates for each point, as well as what shape should be applied to each point for that number. For example, here is the number 2:

The scoreboard itself was built in PowerPoint using basic shapes and text boxes and some inspiration from a combination of various google images. Then multiple scatterplots were layered on top of the image, one for each section of the scoreboard.

At this point our dashboard was pretty much complete. We did add a few additional touches including; a collapsible container containing a YouTube video of legendary Harry Caray calling the exciting last couple innings of this game, a collapsible container with a .gif of this dashboard and an explanation of each section, and sections containing pitcher and batter stats for the current game — as well as the season leading up to the game. The very last step was adding the ability to “step” through the game. For this, we used a simple parameter and a few different filters. We could have also leveraged the Pages shelf for the animation, but because we leveraged separate data sources for some of the vizzes, and had some of them limited to the current batter, while others showed the full history, using parameters was the much easier option.
Final Thoughts on the Viz Collaboration
Brian is an affable/energetic person and a ridiculously talented data visualizer — he uses this and his collection of tools to create the otherwise impossible… possible. The more I communicated with him and witnessed his devotion to the craft, the higher esteem I had for him. I really feel I made a new lifelong friend that I will continually collaborate + grow in the community with — if there was no datafam, none of this would have been possible. In a nutshell, that’s the ‘secret’ power of a successful collaboration.
Music Morsel
Some of the most intriguing/creative music came from the 1980s because the inclusion of electronic instruments (besides guitars) and genre-mashing/creating. Many of these musicians were inspired ex-punks trying their hand at the equipment they often put together themselves. OMD had a lot of minor hits in the USA, but this was one of my favorites as it’s a brilliantly-produced piece with a superb video for the time (but not with the fame of some their other songs).
Binge Bite
If you haven’t started watching The Marvelous Mrs. Maisel, you done yourself a disservice. This adult-themed show is hysterical, brilliantly-written & perfectly casted. It uses brilliant independent protagonist women to poke at the bear of a gentile male-dominated society (unfortunately, many women and minorities have to deal with similar issues today).
Footnotes:
1) Caroline is the Program Community Lead at Tableau and also Co-Lead of Data + Women in London. She did a fantastic job preparing me for the event and facilitated it flawlessly. She’s very kind and thoughtful and was so happy to work with her.
2) Check out Zach’s new podcast coming up on 1/1/20 called Data + Love — I had a chance to hear an episode and it’s going to be a blast!
3) Thank you Jacqui Moore (@jaxx084) for putting up with us — she’s a great data visualizer and community member, so give her a follow on both links4)
4) I am currently leading Jeff by 1 point for the league lead!
5) Just keeping it real… from this point on ‘we’ mainly means him. His absolute genius is what made this viz very special and exceeded my expectations!