The #DataFam: 129 Authors From 21 Countries Spanning Six Continents Share Their 2020 Tableau Inspirations

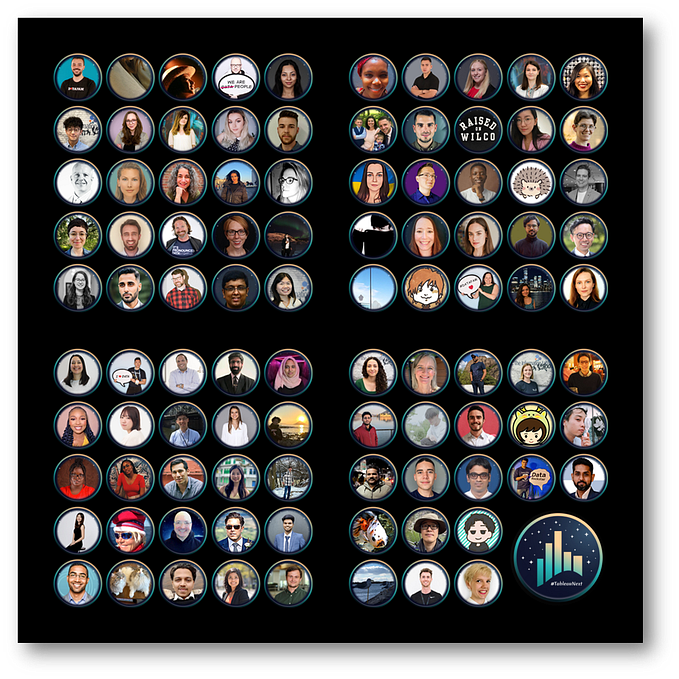
Link to the playable mosaic version!
Introduction (by Adam Mico)
The #DataFam is a collection of people who love Tableau. It’s grown from a marketing hashtag to an increasingly inclusive global community of users who share much more than their love of the product.
My participation in the datafam community did not begin until August 2019 (5 years after I started with the tool). As many will share, it not only made me better with the tool, the friends you gain and initiatives to support can also help enrich your personal life.
Following the 2019 Tableau Conference, for American Thanksgiving, I wanted the spirit of the Tableau Conference to continue — it was very important to me to have a community blog post with many contributors thanking Tableau and the data analytics community as I shared my gratitude for them shortly before that. The collaborative blog post of 79 authors was widely shared and was a source of pride for our community. 2020 was a horrific year on many fronts, but our community saw so much growth and inspiration despite the horrors this year pressed on us.
Our community is much more rich, diverse, and global than ever (although there are ways we can continue to improve). I couldn’t let this year pass without celebrating this with you. If you are new to the Tableau #datafam community or have been a non-committal lurker, please join us as we make a difference with data, friendship, and purpose.
Grab a beverage of your choice and a comfortable seat. Be open to welcome your full range of emotions in the next two hours as the positive, empowering, and invigorating text unfolds & go to the bottom for a viz-tastic treat by Stephen Lindsay!
Blog Topic
Please share your story about a person or people who gave you hope, made you smile, or helped inspire you in our datafam in 2020 and what it meant to you.
Abisola Oni (Nigeria)

Twitter | LinkedIn | Blog or Website
I absolutely love the Tableau community and it has been one of the best things to happen to my career journey.
I started not having anyone to share my Tableau learnings or experience with finding a corner of the internet where there is complete support, love, and enthusiasm about data analytics and visualization.
2020 being the tough year that it was, the Tableau Conference allowed me to meet even more people from the brain dates to the Tableau Doctor sessions. It was amazing to learn how other people are using Tableau and their journey so far.
Thank you to everyone in the community for being beacons of hope and inspiration!
Adam Green (England)

Twitter | LinkedIn | Blog or Website
It’s been a crazy ass year….
Laura Sanford and I kicked off 2020 with a cheeky little project called the ‘Alphabetproject’. We hoped the project would help develop our dataviz craft, teaming up would enable us to learn from each other and encourage momentum through the year. Each of us would viz through themes based on the letter of the alphabet on alternate weeks throughout 2020, incrementing the alphabet letter every 2 weeks.
As of writing this post, we are on the letter “W”…nearly completing the alphabet! This project and my wing-buddy Laura have given me hope in times of despair, given me something to hang on to in times of anxiety and dismay, taught me tonnes, made me smile, inspired me, and brought out my love, passion, and creativity for data visualisation in Tableau. If I’m honest, without the distraction of a purposefully light touch and at times comical viz to work on throughout this crazy-ass year, I’m not quite sure where my sanity-ometer chart would be pointing!
I have repeatedly questioned myself whether I should be publishing such light-touch visualisations during these emotional times, but decided I needed the distraction and maybe others did too. Laura and I have had a blast and inspired each other week after week during this year and hand on heart I have looked forward to every Monday of 2020, eagerly anticipating what Laura has conjured up or by publishing my own viz for the public to see. The project has been received well and we have had such encouragement throughout the year from datafam and the community at large, we have grabbed a few VOTDs (Tableau Public Viz of the Day) and had a few honourable mentions on Andy’s ‘Best of the Tableau Web’.
For this we thank you all — it has spurred us on, made us smile, inspired us to carry on, and has meant a whole heap too. But most of all I want to thank Laura for always being on the other end of a whatsapp chat week after week.
Laura you’re a leg-end!
Adam Mico (United States)

Twitter | LinkedIn | Blog or Website
This year, the evolution of the Tableau community has inspired me. In March, my desire to participate was slowly fading. I was tired, failing my fending off of autistic burnout, and the pandemic was quickly approaching. It was all too much and put me in a negative frame of mind. I took a break. A few weeks later, I popped in and there was so much talent, increasingly diverse representation, and a community full of givers. I realized what I missed and gave me stronger goals to somehow manage very difficult and stressful work and try to make an impact. Mentoring called to me and I realized its personal benefits immediately. Seeing Priya Padham, Sedale McCall, Alison Pitt, and Pawan Sachdeva excel in their own ways and knowing it will work out for them because they all have talent, drive, and a strong desire to pay it forward. Besides, formal mentoring, it’s fun to support and help encourage so many people in our community with similar ideals and an aspiration to contribute to our family’s growth. Seeing them and knowing how high their ceilings are, keeps me motivated every minute it’s needed and makes me increasingly proud to be part of our community.
Even before that, I had the chance to meet and hang out with community friends in January. I covered this extensively here, but meeting and chatting a lot with Sarah Bartlett, Kevin Flerlage, Dinushki ‘Dee’ De Livera, Jeffrey Shaffer, Zak Geis, Ann Cutrell, Jim Dehner, and others I knew from the community, helped me appreciate that these people weren’t acting a part, but genuinely good friends that were even more fun and engaging in real life than on social media. It gave me the confirmation I needed that our ‘fam’ was more than a mirage.
Another big shoutout goes to Hunter Hansen. In recent months, he started a YouTube channel. His channel (and blog) has made a massive impact and is helping pave the way for autistic people like me to feel a little freer in our own [slightly unmasked] skin.
Finally, I’m inspired by the community as a whole. MentoringMeetup (an initiative co-lead with Sarah Bartlett, Emily Kund, Mark Bradbourne, Vinodh Kumar V R, Sagar Kapoor, and Brian Moore) can only thrive because we have so many selfless people looking to help others by paying it forward. We have nearly 50 mentors engaged with over 70 students or mentees. The impact this has made for the careers, confidence, and desire of so many has made it so worth any time I spent helping manage the initiative.
Agata Ketterick (United States)

Twitter | LinkedIn | Blog or Website
At the end of 2019, I discovered this thing called #MakeoverMonday. I had a feeling that if I stuck with it, I would get better at data visualization. Little did I know that out in the Twitterverse and beyond there was also this community called the #datafam. Week by week as I submitted my #MakeoverMonday challenges, I discovered that the #datafam was this wonderful group of people from all over the globe who love to geek out on dataviz. Along the way, the lovely Michelle Frayman invited me to join #momswhoviz — a hidden gem for all of us moms who are trying to juggle so many things. And as Michelle and I talked more and more, I discovered I had made a friend. This year has been full of the unexpected, but for me, that has also meant a few wonderful surprises. #Datafam — thank you for being so full of encouragement and inspiration. #Momswhoviz — keep on rocking as mamas, data vizzers, and friends. And Michelle, thank you for always being there to listen!
Aida Horaniet (Luxembourg)

Twitter | LinkedIn | Blog or Website
Even though I have used Tableau at work for about 6 years, 2020 is the year in which I have also started working on personal projects, learning new techniques, and visualizing data on topics previously unknown to me. The truth is that despite the circumstances, 2020 has been a fantastic year in that sense! And this is an opportunity to thank some of the people who have helped me, inspired me, and made me smile during the adventure. Here we go!
First of all, thanks to Chloe (@datachloe), with her fantastic energy, to Vanitha Lucas (@vanithalucas) and Frederic Fery (@fredffery) and to and to the entire team of #vizforsocialgood who has inspired and helped me to do what I find most rewarding, to use the data for social good, allowing me to create a chapter in Luxembourg.
Thanks to Klaus Schulte @ProfDrKSchulte, who accepted to be my mentor, and explained me, always with a smile and a lot of patience, new concepts that have allowed me to experiment with new techniques in Tableau. Besides being always available to give me feedback and encouragement about any project!
The blog that gave me the last push to start writing www.dataconfab.com was ‘How to start your own Data Viz blog & why you should’ by Sarah Bartlett (@sarahlovesdata), changing my mental chat from why not to why I should. Thanks a lot for that!
Marian Eerens (@M_Eerens) definitely made me smile by inviting me to speak at the last #TUGBelgium. What a pleasure to participate in a TUG from the neighboring country! I hope we can join forces in future projects!
And last but not least, Adam Mico (@AdamMico1) and Vinodh Kumar V R (@VinodhDataArt) are a permanent source of inspiration, for the friendly, helpful, constructive, and collaborative approach that characterizes everything they do, always showing the way about everything that can be achieved by helping each other and using data visualization to increase awareness about important issues. Thank you for motivating me to participate in numerous projects, and for making me feel always welcome!
Alaina Prevot (England)

Twitter | LinkedIn | Blog or Website
I am relatively new to the #datafam, and I kind of joined unintentionally. One of the people instrumental in getting me here was Ghafar Shah. When I began participating in #MakeoverMonday over the summer, it was a personal effort to dust off my viz skills and commit to creating — I by no means expected anyone to see my work, let alone someone whose work I really admired. Ghafar was one of the first people to provide encouraging comments, which motivated me to keep going and stay engaged. It is inspiring to see how he manages to produce beautiful vizzes as well as continuously radiate kindness and positivity through interactions with others. Although I’ve not properly met him, Ghafar has really set the bar for me with regards to the type of community member I aspire to be, and I am grateful for his contributions and the impact he’s had on my journey.
Alex Waleczek (Australia)
Twitter | LinkedIn | Blog or Website
As for everybody else, 2020 was a weird year! Apart from the obvious fight with a pandemic and its effects, I decided to resign from my job to take a bit of a break. The immediate effect was that — on top of being locked down at home — there was no social interaction via work meetings. I quickly realised that I would miss the daily contact with clients, suppliers, and colleagues.
Apparently, a lot of others felt the same and virtual meetings quickly popped up. Katie Wagner started to organise some Remo sessions, together with Emily Kund, Kevin Flerlage, Sarah Bartlett and Lorna Brown we started the DataFamCommunityJam’s and everything culminated in the virtual Tableau conference which in itself was a great feat but to be honest, the technical content was overshadowed by the huge amount of dedication that the community put into it — sharing their knowledge via braindates, organising watch parties on zoom, having a virtual lounge to hang out and even organise a virtual data night out.
It was a lot of fun but most importantly I saw how these virtual gatherings had a huge impact on people who were suffering physically and mentally from the measures against the pandemic.
I think we as a community can be proud of that dedication and care for each other. There were and still are countless efforts to stay in touch and delivery virtual experiences instead of in-person meetings (and a big shout-out to all the TUGs who moved to zoom!).
To everybody who organises these virtual sessions and helps people to stay connected, a huge THANK YOU! And don’t underestimate the impact these sessions can have on people who really have a hard time coping with the situation we are all in at the moment!
Alexander Varmalov (Russia)

Twitter | LinkedIn | Blog or Website
This year the Tableau community received a lot of new members and I personally get a new breath of air — so many new styles, designs, and insights they brought to the community. I would say that all people in #datafam who share their experience definitely inspired me to make new vizzes and solve new tasks.
In February I started to write my blog inspired by plenty of authors. I like technical articles, so my favorite blogs are the Flerlage brothers’ blog and Datablick’s blog. This year I was very influenced by the #VizConnect initiative hosted by Divya Bharathi and Sagar Kapoor. The influence of the VizConnect is extending involving more speakers and team members. For me, it’s a huge stage to share the experience and learn from people who love data. Personally, I was invited as a speaker twice and it was a big step for me because public speaking is not my strong side. it helped me to be more confident.
Also, I was glad to collaborate with a Russian-speaking community leader Egor Larin. We have created a couple of projects. He is an outstanding person who has worked ten years with Tableau, knows tons of tricks, and suggests insane Tableau ideas.
In conclusion, this year is tough for all of us, but the #datafam is a place where I forget about problems, enjoying this smart community, new data projects, new approaches, and new data experiments.
Alison Pitt (United States)

Twitter | LinkedIn | Blog or Website
My first introduction to the datafam was during a time of incredible personal stress. We were in a pandemic, and I had recently lost my job. I was finding it difficult to get my resume up to speed. I struggled early on to learn Tableau (something I’d seen as a “nice to have” on several job postings), and then I tried #MakeoverMonday. All of a sudden, there was the #datafam. They were everywhere! Practically coming out of the Twitter woodwork, a whole community of people helping each other, celebrating each other’s accomplishments and driving each other to improve.
I’m sure everyone has an “Adam Mico” story (he did win the community leadership award at this year’s Tableau Conference-ish!), but for me, Adam was the person who lifted me from feeling like “one of the crowd” to an individual in the community. He noticed me, #FF’d me, and gave me that little confidence boost to help me find my feet.
I do think that eventually, I would have gotten there on my own (found my confidence, I mean), but Adam definitely gave me a head start. I guess it just takes one person to look at you and say, “I see you”.
Allan Walker (United States)

My Tableau inspiration for 2020 was being able to collaborate with Anya A’Hearn, Tamas Foldi, Johnathan Drummey, Nick Hara, Steve Schwartz, and Jeremy Blaney alongside partners Datablick, Snowflake, AWS, Starchema, Mapbox, PATH, and Mulesoft. We all came together to create the Tableau COVID-19 Data Resource Hub.
Allen Hillery (United States)

Twitter | LinkedIn | Blog or Website
“You won’t know how strong you are until you know how strong you have to be.”
I came across this line while reading Rae Carson’s “Star Wars: The Rise of Skywalker”.
It’s a reassuring phrase as I reflect on the past few years especially 2020. I recently changed course in my career to focus on family and find fulfillment. It’s been a scary, exciting, and fulfilling time all at once! 2020 has definitely brought turmoil and uncertainty but it also brought validation. My article series on data and the impact it has on society has evolved into a social platform that is encouraging and inspiring many. It has also allowed me to connect with a lot of amazing people who I’ve gotten to chat with, learn from, and even interview for my blog. Ben Jones is an amazing friend and supporter who encouraged me to keep writing and to keep plugging away at my data literacy for all initiatives. So imagine the feeling of joy when I got a chance to talk with Tableau’s academic director about their recently launched data literacy for all program that sits outside of the paywall!
Adam Mico is another amazing DataFam who has been nothing but welcoming. I applaud his introspective blog posts. Sharing his journey with us is a vulnerable and courageous act that he may never know just how refreshing and appreciated it is. His enthusiasm for community is infectious and one of the inspirations for writing this post!
Spencer Bauke has been a great person to get to know. I stumbled across one of his Twitter posts on the Transatlantic Slave Trade and knew I had to get him for an interview. We had a really great collaboration and are jumping in the lab again!
Bridget Cogley is another DataFam member who encouraged on this data journalism journey. I recently gave a workshop for one of Tableau’s Analytics Days on Leading With Data Empathy and Bridget played a huge part in encouraging me to put it together!
Two people I look forward to getting to know better are Candra McRae and Sekou Taylor. We’re all participating in the Tableau Ambassador program and it’s been great to hear them share their thoughts and backgrounds. It’s comforting to see that level of diversity in the datasphere.
2020 has definitely had its share of angst, unrest, and plot twists but experiencing the data fam along with being a Tableau Social Ambassador has given me hope and made me smile. It’s been a huge validation that I’m on the right path. For those reading this post, stay encouraged. If you’re shifting gears, changing course or doing a complete reboot, don’t give up. Keep going. Don’t be afraid to break the pre-conceived mold in your mind or out in the world on who you’re supposed to be.
Aloysius Ong (Singapore)

Twitter | LinkedIn | Blog or Website
Dzifa Amexo is my datafam inspiration for 2020. I was making data visualizations for #dailycoding for about 5 months now. I was trying to improve my data viz skills on every iteration and was stuck. It felt like I wasn’t making any progress. Be it coincidence or what, but Dzifa reached out to me and wanted to nominate me to be a Tableau Student Ambassador. That made me feel like my efforts were being recognized. Putting out different types of content every day is quite tiring and there are times I feel that I have not been improving. Dzifa’s message lifted me and I saw my progress for the first time as I was compiling the #makeovermonday vizzes that I have done (26 at the time). Doing #dailycoding for the past 7 months, it was the first time that I went back and look at when I first started. Comparing the first viz which I produced then and now… there is a huge difference. Both my style and designs changed over time. She has inspired me so so much since that time on my #dailycoding and data viz journey. Thank you so much Dzifa Amexo! :)
Anjushree B V (Canada)

Twitter | LinkedIn | Blog or Website
Tableau community, to me, has been a tremendous source of inspiration, creativity, growth & encouragement. It has made me constantly push my own creative boundaries & to realize my deep interest in data art.
Brian Moore has been an amazing mentor & my go-to person for vispiration check before I post any viz. His work is exceptional & I can’t thank him enough for sharing his expertise. I am fortunate to constantly have some insightful conversations with Adam Mico, Chris Love & Chantilly Jaggernauth leading to new areas of growth & visual exploration.
I feel blessed to be a small part of this supportive community.
Anna Foard (United States)
Twitter | LinkedIn | Blog or Website
Different people at different moments made an absolute difference to me in 2020. March was hard. As a mom with a career, the shut down of schools, parks, playgrounds shut me down completely. At that time, I had some short, but especially meaningful conversations with Lindsay Betzendahl that made me feel human and rational. I could finally admit it was okay to not be okay. At the same time Christian Felix (THE Christian Felix) reached out to me with several questions and I felt a renewed joy to work on a Tableau project that allowed me to focus on the GOOD things in the world and my life. A month later and through today, it’s been Nelson Davis, Karen Hinson, Ryan Nokes, Jenn Lisborg, and Nathan Settembrini who encourage me and motivate me at the exact moments I feel unworthy. Eman Alvani, Emily Kund, and Cesar Picco are ALWAYS there, no matter what, to offer a helping hand, a word of encouragement, or just an appropriate laugh. But I cannot leave out Katie Wagner, Sarah Nell-Rodriquez, Kevin Flerlage, Will Perkins, Ryan Nokes, Will Strouse, Michelle Gaudette, Zach Bowers, Michelle Frayman, Christina Gorga, and Vince Baumel who continue to show up as encouragement before and throughout 2020, both professionally and as friends. As I write this, I keep adding more names. I am sure I will leave someone out — the list is very very long, so I hope I haven’t forgotten anyone!
Annabelle Rincon (Switzerland)

Twitter | LinkedIn | Blog or Website
After I moved to Zürich 7 years ago, I couldn’t find a job as a Data Analyst, until a fantastic person gave me the chance to have an interview. They were searching for a data analyst who could learn Tableau Software. The instructions were quite simple: (1) download Tableau and (2) analyze this dataset. I still remember the first impressions I had using Tableau, the speed and flexibility which I fell instantaneously in love with.
After 7 years, I am now Tableau Certified Professional and a Tableau Ambassador. Thank you Laure Fouilloux! Your faith in me changed my life. Not only because you offered me my first job in Switzerland, but because I found a new passion in #visualanalytics, a mixed discipline between maths and art and I have been trying with my blog, public profile, and now these #datapluswomen initiatives to give back to the community. This is the community I feel I belong to.
Aparna Shastry (India)

Twitter | LinkedIn | Blog or Website
2020 has been a roller coaster ride for me. Especially in the Tableau community, though I had been inactive for over a year, the community was very welcoming. This year, my goal was to learn about storytelling, user-friendly designs, and to push myself to get involved in the community (this particularly was terrifying for me as I’m an introvert and this was totally out of my comfort zone for me). I started my journey with makeover Monday, Ironquest, and viz for social good as I felt these would certainly help me in focusing on my goal. The notable challenge for me was “Magic, Myths & Mysteries” of Ironquest. The reaction from datafam was very encouraging, I was glad that it was received so well. Especially Sarah Bartlett and Sam Parsons, who were the judges for the month provided valuable feedback.
Then came the Tableau conference… something that I was looking forward to and was finally able to participate in. As expected, I was a bit intimidated at first, when I went through the conference activities, especially braindates, but again this was a year where I had to push myself so I did. And I was so glad that I did, it was a great experience and I feel was the main turning point for me this year. I interacted with so many awesome people from datafam and learnt so many new things!
There were numerous takeaways from all those conversations, and I would like to mention two here. Firstly, I would like to thank Divya Bharathi for so many valuable ideas on how to start your internal Tableau community, it has certainly proven beneficial for me in my day job. She was also the first person to welcome me back when I published my first viz after a really long time. Next, I would like to thank Adam Mico, for being so down to earth and offering to look into my Space Exploration viz, which I had not expected as it was our first conversation. Talking to him was insightful and was filled with wisdom and knowledge, after which I also realized that I had to revisit my journey for this year and next. I took this past month to do just that.
Lastly, I would like to thank the entire datafam community for being so welcome. I am really proud and grateful that I am part of this wonderful family! Happy learning to everyone!
Autumn Battani (United States)

Twitter | LinkedIn | Blog or Website
I was using Tableau for about a year before I knew Tableau Public existed. My very first event at the 2019 conference was Makeover Monday Live. I wasn’t even sure what that meant when I signed up for it but I was determined to attend everything I could. I was honestly a little taken aback by the fact that people were doing this recreationally but I was immediately intrigued as I knew it was going to help me sharpen my growing skills. I posted my first viz on public shortly after and shared it to Twitter per the instructions. I got a comment. Michelle Frayman said welcome (as I stated I was new to the exercise) and complimented my viz. She was the first person to follow me from the community and the first to make me feel like I wasn’t creating in a silo. I followed her back and was so impressed by her consistency. It made me want to do more. Engage more. Participate more. There are a LOT of people in this community who have encouraged me, inspired me, and consoled me along this process. And I don’t know if it would’ve happened if Michelle didn’t take time out of her day to send me that piece of light even though she didn’t know me or my (non-existent) work. I think of her OFTEN. Every time I’m grateful for the community I’m so grateful for that tweet that brought me closer to meeting some of the best people I know. And it’s a reminder that it doesn’t take much to really change people’s lives. My 2020 was entirely changed by the #datafam. Phew okay. I teared up while writing this.
Brian Moore (United States)

Twitter | LinkedIn | Blog or Website
Our community is overflowing with truly inspiring people. I have learned so much from this extraordinary group over the last year and my only hope is that I can give back even a small fraction of what I have received from all of you. To highlight everyone who has inspired me would be impossible, but there are a few people that I want to call out that have really gone above and beyond. People that I’m lucky enough to call friends and family. People like Adam Mico, Vinodh Kumar, and Jacqui Moore. The four of us all started getting active in the community around the same time and watching the transition of these three individuals from community outsiders, to active members, to community leaders in the past year has been truly amazing. Each of them in their own ways has dedicated themselves, and no small amount of time, to helping others in the community grow, and it’s been truly inspiring. I am incredibly proud to be part of some community initiatives with this group and can’t wait to see what the future has in store for them.
I also want to give a shout out to the #DataFam Game Night group. This started as a small group that would meet regularly to play games over zoom at the beginning of the pandemic, but it’s grown into something much bigger than that. It’s a group of amazing people that you can always turn to for a laugh or for support during a difficult time, and it has been just a constant beacon of light during these dark times.
Bridget Cogley (United States)
Twitter | LinkedIn | Blog or Website
As most people know, I lost Kelly Martin in 2019 as my beacon of hope, mentor, inspiration, and best friend. I came home that October broke in a way few will understand. 2020 has required a team, so this is probably going to read more Oscar’s Acceptance speech than a story. As usual, this is not an exhaustive list and I guarantee I am going to fail to mention key people. I’m sorry in advance: you are loved and you can hurl tomatoes at me later.
A few people I want to call out.
Michelle Frayman, for showing up and being there on the regular. You’ve gone above and beyond as a potential stunt double. Maybe TC21 we can do REAL switcharoo antics.
Candra McRae, for sharing outrage, collaborating, and providing comedy recommendations, but also being a voice of reason for both me and the greater community.
Kyle Yetter, for being “grief buddies” and sharing giggles. So, so, so needed.
Vidya Setlur, for always lifting me up as we collaborate. It’s been a breath of fresh air and I so look forward to the party and the book.
Allen Hillary, for being a delightful surprise friend this year and being a champion of data literacy.
Autumn Battani, for being an original artist and analyst across several platforms and just having fun. I may not always partake, but I appreciate it all so much.
Johanne Lemaire, for being my backup Canadian AND an excellent data Lorax. It makes me smile.
Young C. Song, for checking in and being there while doing a Ph.D. and despite massive time zone differences.
Alex Dixon, for being there and always pushing for accessibility and accountability.
Joshua Smith, for being in range to get Jeni’s when it’s not CoVID-times and our chats, along with calling for ethics.
Sarah Nell-Rodriguez and Christina Gorga, for chats, tea, pictures, and intermittent phone calls.
There are a number of people who tolerate my rants in DMs or who periodically check-in. Thank you.
A bunch of people hopped on Braindates with me this year and made the conference that much better. Thank you.
To everyone who has remembered Kelly this year, cited her work, or introduced someone new to her, thank you.
To the folks on the Equity Task Force challenging the status quo and pushing our community to be better, thank you.
Final call out — Adam Mico — for putting these things together that provide hours of delight.
Often, it’s the small things that matter. The small pings. The intermittent shares. The fact that someone reached out and cares what happened that day. I will always miss Kelly and Michael, but they each live in different parts of you. So, thank you.
Brittany Rosenau (United States)

Twitter | LinkedIn | Blog or Website
I started Makeover Monday at the beginning of this year, and in February Eva Murray happened to be in Seattle giving a talk near my office. I did not know what to expect, but it was fun to meet in person someone I had only heard through audio from a few Makeover Monday review webinars. The talk and our chat were personally very encouraging, especially as a woman in the tech industry. While lockdown has prevented more in-person events this year, that encouragement to just keep participating in Makeover Monday has opened my virtual world to a whole data community, and I look forward every week to hear what Charlie, Eva, and Andy say on the videos — and to be inspired by what the greater community produces with each new data set. I’ve learned so much, and hope that I can someday provide that same level of encouragement and constructive feedback to others on their journeys with data viz.
Candra McRae (United States)

Twitter | LinkedIn | Blog or Website
Bridget Cogley is a person that both offers hope and does the work to drive change not just in the #datafam, but in causes that matter to lots of people. She is always willing to challenge us to think about the human element and ethical considerations of what we do. I see her constantly amplifying different voices, topics, and making room at tables she sits by connecting dots and suggesting new names for opportunities. She is constantly working to make things better but doesn’t shout from the rooftops every time she makes a move and helps someone. I doubt people in the #datafam understand the extent of her contributions, but if she stopped doing what she was doing…it would be felt in real terms. She’s definitely an unsung hero and someone that I am constantly inspired by her willingness to “do the work.” In short, she’s a real one, a member of the yaya curly hair sisterhood (no traveling pants), and I’m proud to call her a friend.
Chantilly Jaggernauth (United States)

There were a few people who truly made me smile this year- Jordan Scott, Sarah Bartlett, and Eric Balash.
Jordan Scott: I truly enjoyed working with her and the team to launch the Diveristy+Data series this year. The initiative meant a lot to me personally and I was glad that Jordan reached out and asked me to be a voice for it.
Sarah Bartlett: Sarah has grown to be a friend of mine over the years. Despite not being on Twitter lately, Sarah still reached out and checked on me and my family during the trying times of this year. Just a simple and genuine, “how are you?” meant so much. Thank you so much Sarah for being a friend.
Eric Balash: Eric began working for Lovelytics this year and since then he has truly become like a brother to me. I appreciate his work ethic but most of all I appreciate our daily laughs and small chats. On some of my toughest days at work, I could always count on Eric to lend a hand or a smile :). He’s also become one of the leaders for Millennials and Data and I truly appreciate his support in impacting the lives of our students.
Cheryl Tan (Singapore)

Twitter | LinkedIn | Blog or Website
I think what made me smile (and tear a little bit) was actually when Adam Mico actually congratulated me when I got featured as a public author and commented on my work. I always felt my work was very mediocre but your kind message made me realise that I’ve made progress and I needed to recognise it. It also made me feel really welcome and made me realise the data community is a lot more friendly than one that just celebrates a few people’s successes.
Chimdi Nwosu (Canada)

Everyone I’ve interacted with in our community has been awesome!
When I first got acquainted, Kevin Flerlage was one of the first people to reach out and offer support and was always super helpful whenever I reached out with questions.
You also have a guy like Adam Mico who was kind enough to show how a few things worked at the beginning and really supportive.
Beyond my experience with these and other awesome people around, something I’ve noticed in the datafam is that whenever anyone needs help, there’s always someone on the other side willing to lend a hand. This really stood out to me and because it happens so much it's like this constant reminder of how to be to and for others.
Participating in Makeover Monday is another awesome thing about the datafam. It’s really inspiring to see so many express themselves through visualization while helping and supporting each other grow.
Overall, there’s lots of room to branch out and grow and I look forward to seeing what comes next.
Christian Felix (United States)

Twitter | LinkedIn | Blog or Website
Who inspired me this year? Pretty much every working mom who found themselves holding down a job, trying to homeschool kids while simultaneously vizzing and giving back to the community; encouraging others, practicing their craft, and growing their skillset. Ya’ll are amazing, dedicated, and inspirational.
Christina Gorga (United States)

I was really inspired by the #MomsWhoViz group I began to organize with several others in the community last year at TC 2019. We have a Slack channel and ongoing conversations about striking a balance with our multiple identities as data visualizers and mothers. As COVID-19 has impacted our population harder than many in the working world due to our often default status as primary caregivers, we have been discussing and putting a lot of thought into our role in the data community and how we are being impacted. The pandemic is far from over but having a group of women who I can identify with as colleagues and human beings have been essential to maintaining my sanity and creativity this year.
Darragh Murray (Australia)

Twitter | LinkedIn | Blog or Website
Frederic Fery has been my biggest inspiration in 2020. I’ve known Frederic since our time working together at a local university here in Brisbane, Australia — and I admire his passion for not only data visualisation but also topics on social justice, inequality, and related concepts. He’s been supportive of getting locals excited here in the APAC region — organised and thinking critically about how we can use data and visualisation for social good (hence why he has managed to get me somewhat involved in #VizForSocialGood). While I wish I could spend more time doing some more data visualisation on these important topics, the bits of work I have completed have usually been at the encouragement of Frederic.
David Borczuk (United States)

Twitter | LinkedIn | Website or Blog
When I started creating visualizations for Makeover Monday, it was Pablo Gomez who really inspired me to take my design skills to a new level. His beautiful infographics and storytelling capabilities made me want to be a better data viz designer. As my involvement in the #datafam community grew, it was evident that inspiration could be drawn from almost everyone. We are like one giant hive mind where we cultivate best practices and great design styles to share with others. That’s what separates the Tableau community from a lot of other communities — it is hard to choose just one person or even a group of people. Each community member is a gear in a well-oiled machine of data visualizations, and each person’s contribution is important. I think special attention should be drawn to those community members who strive to keep the #datafam galvanized and excited: Sarah Bartlett, Adam Mico, and Zach Bowders to name a few. With the help of these community members, I have watched the #datafam grow so strong, and I am confident that we are just at the tip of the iceberg!
Diego Parker (England)

Twitter | LinkedIn | Blog or Website
Last August I was invited to be part of the creation of Comuni(Datos), the first Tableau User Group for the Latin American community. The group is a place to give representation to the Latin American community within Tableau and allows people like me, that are living somewhere else, to keep connected to our roots. In a year marked by the lack of social relationships, I feel really blessed to be part of the steering committee of ComuniDatos along with such friendly, talented, and passionate people. We have only done two meetings so far, but we already have over 150+ active members in our Slack channel. We listen to Latin music, debate on Latin American topics, and learn some Tableau along the way. The reception of the group has filled me with joy and inspires me to keep helping the Spanish-speaking community to see and understand their data.
Dilyana Bossenz (Germany)

Twitter | LinkedIn | Blog or Website
Tableau Community is a huge one and there are a lot of people who inspire me every day. When I see what people create and in which frequency, it motivated me also to create, learn, and share.
I thank people, who share their knowledge by writing blog posts, doing podcasts, speak at different user groups, open their workbooks on Tableau Public for downloading and run diverse Tableau projects. Everyone, who contribute and generate a great context, has a great value for Tableau Community.
This year I had my own aims for learning: I wanted to learn Adobe Illustrator and how can I use it for Tableau. Thus, this year my personal inspirations were the works of Sam Parsons and Judit Bekker. Both have an incredible sense of design. I thank Sam for giving me feedback on my Viz: Food Carbon Footprint Index. He took the time and give me very constructive feedback, which is gold worth. I was so happy to create this beauty. I also appreciate the contribution of Judit, as she created great work and share her knowledge in diverse form.
The second aim was to learn Mapbox and to use these maps in Tableau. I am a big fan of the work of Jonny Walker, who uses both Tableau and Mapbox. His stunning vizzes are always fascinating to me. I was so excited as he organised a virtual event, where he explained his approach. Here is the link to the video. Jonny is always ready to help and answers all questions if you got stuck. After his presentation (he is BTW a great speaker), I wanted to open Mapbox to create maps.
The contribution of these people inspired me to create more. I have a lot of ideas, that have still not been implemented.
Dinushki De Livera (United States)

Twitter | LinkedIn | Blog or Website
Lately my co-founder of Her Data, Jennifer Dawes has been my data partner in crime. She has inspired me, made me smile, and is always willing to listen to me ramble. She is a wonderful member of the community and I’m so lucky to call her my friend. So I just want to appreciate her here :)
Kevin Flerlage is no stranger to anyone in the community but lucky for me, he is also my co-worker! He is always one call away from solving my Tableau problems whether it's work-related or a personal viz. He is so patient and always has the best advice. I don’t have a particular story or incident but want to show my appreciation for everything he does for the data community and thank him for putting up with me on a daily basis!!
Domagoj (Croatia)

Twitter | LinkedIn | Blog or Website
For me, the most inspiring person is Toan Hoang. I thank him for everything, but mostly because his visualizations helped me explain to people what “Visual Analytics” means.
Dragan Anca (Romania)
Thank you Madalina Andrei and Sergiu Rotaru for welcoming me into the #RomanianData community. I am grateful for the feedback and study materials received from them.
Dzifa Amexo (United States)

Twitter | LinkedIn | Blog or Website
“Hope is the companion of power, and mother of success; for who so hopes strongly has within him the gift of miracles.” — Samuel Smiles
If someone had told me last year that I would be obsessed with the software and the community around it, I would’ve laughed. But I’ve reached the point where in my daily life the thought “Omg that would be such a cool viz” has become a frequent occurrence.
If you’re reading this…you’ve inspired me at one point or another. That’s the crazy thing about the data fam, even though I have never met any of you in person or even virtually met some of you. The inspiration and hope lives in you, your work, and beyond. Thank you!
You may feel like your work doesn’t inspire people, I did for the longest time but you never know who is watching. And I mean this in the best way possible…not in a way that puts pressure on you. Tableau for me is honestly a hobby that I enjoy and love but it’s a bonus to be able to inspire others and contribute to this amazing community. It wouldn’t hit the same without the data fam!
Listen 2020 has felt like 5 years in one, there were highs and lows, many many lows. But the data fam was definitely a high for me. I could honestly write a book on this but here a few moments:
- Warm datafam welcome from Adam Mico & many others in February after I posted my Tableau Resume
- Hearing that this has been an inspiration for others was an inspiration in itself
- A special shoutout to my mentor, Sarah Bartlett: Sarah has been instrumental not only in the growth and improvement of my work but overall as a person! I still remember earlier this year, when she named me as a #TableauFF to when she Dm’d me on Twitter letting me know I was named a Featured Author. My motto is: the best things happen outside of your comfort zone but to be honest, it’s scary! Sarah pushes me to be the best version of myself and try new challenges! (WoW is the latest one)
- Sarah has been there to guide me and provide feedback on my vizzes at any hour, motivate me to speak at events, and support me through all these first-time endeavors to make the most out of them. I don’t know how she has time to do all of this & be an amazing human being in the real world but thank you Sarah! We also have the best conversations on anything from Tableau to concerts & life
- TC-ish Braindates: I had some wonderful brain dates that left me feeling inspired and re-energized on topics such as imposter syndrome & just life in general
- The pre-TC tailgate was also amazing and so fulfilling to see and get to know the person #behindthetwitter
- Literally, almost every time I’m on Twitter: (I’m trying to limit my social media usage but when I do go onto Twitter) there’s always a slice of positivity — whether it’s a new viz or a screenshot of a meetup, someone asking for help and getting it, or anything else like Autumn’s murder mystery game, a delicious recipe, or just a funny gif
Titles aren’t a huge thing to me, don’t get me wrong, not in the sense that I don’t appreciate them! Okay and I’m not going to lie, as a natural-born Leo, I do love the attention and validation it’s in my DNA. But I say all of this to say that even without the privilege of the title, I would still bring the same energy to the datafam. I’m also EXTREMELY grateful for all the positions and opportunities that the datafam has afforded me to be involved in the short time I’ve been here. It’s truly contributed to my personal and professional goals and allowed me to do my favorite thing — give and inspire. Even when I didn’t feel deserving of things, y’all congratulated and celebrated me!
The datafam as a WHOLE inspired me in 2020, granted I just discovered it this year so I can’t make any comparisons to last year. But in the short (but long time — 2020 felt like 5 years) time I’ve been here for this journey I’ve been inspired by the newbies, the oldies, the ambassadors, the zens, the first time makeovermonday-ers, those looking to build up a data culture in their workplace, or those just looking for a creative outlet.
If you know, you know…that I genuinely love helping people and seeing them succeed and achieve their goals. Not everyone in the “real world” is like this but everyone I’ve met so far in the datafam is selfless and welcoming. That is what inspires me, the datafam is the gift that keeps on giving.
I would be remiss if I didn’t call out a few names (please bear with me there are so many but here are just a few that have inspired me or given me hope in humanity, whether they realize it or not): Abby, Adam, Anita O., Autumn, Candra, Chantilly, Danielle (Dikayo Data), Eva Murray, Ghafar, Katie W., Ken, Kevin, Liam S., Mala D., Maria B., Nena, Pawan, Priya, Sarah B., Sedale, Sekou, Soha, Thi, & Zainab.
- Disclaimer, there are so many more people who should be on this list, but it would take me an eternity to write out. ICYMI the data fam inspires me, in so many ways, which means you because you’re a part of the dataframe…and if you’re not, we welcome you with open arms. Cue: Thank you for coming to my TED Talk. *group hug*
Ella Worsdale (England)

Twitter | LinkedIn | Blog or Website
During the summer I signed up to become part of the new Tableau mentor scheme. I was keen to help someone new to Tableau who needed support and guidance. Within a few days I was matched up with Purva Sawant, and we started to email and meet each other weekly.
I didn’t realise how much I would actually benefit from the process, but it has been some of the real light in a really difficult year. I am constantly inspired by Purva’s dedication to her professional development and her willingness to learn. Purva weekly completes the makeover Monday challenge, and welcomes feedback and quickly iterates following this feedback process. Not only does she complete these weekly she has also been learning python, completed workout Wednesday challenges, working on her presentation skills to name but a few. As well as juggling a full-time job and life!
I love virtually meeting with Purva and hearing about what she has been doing and what she interested in doing next. These sessions always put a smile on my face and I love watching her Tableau Public profile grow.
This process benefits the mentee and the mentor. It has really pushed my skills to make sure I can be a good mentor. Thank you to the Tableau community who created this scheme and to Purva for helping to keep me inspired to learn and make 2020 more bearable!
Emily De Padua (United States)

Twitter | LinkedIn | Blog or Website
For a while (almost a year), I was in a total creative rut when it came to Tableau Public. I would see amazing work and be inspired, but the minute I opened a workbook the following would happen: I would just stare at the screen to start something, decide the project wasn’t worth it, close the workbook, and never let the viz (even if there were any progress) see the light of day again. I would seldom post on my Tableau Public, and even when I did, I was incredibly unhappy about it.
And then I saw Chris Meardon’s tweet (link), and it was the tweet that snapped me out of this internalized performance pressure. Up to that point, I had not even realized I was in this creative rut and where it was coming from. I realized I was putting so much unfair pressure on myself to create a viz to be the absolute forefront of my abilities, to get validation, etc. And I felt relieved, not only to identify and diagnose this issue, but I felt inspired to just try to create for fun. It was a total shift in my brain, and it worked! There was a spark that came back, and in some ways, I felt like my vizzing gears came back to life. I felt inspired bravery to try things, whether it be a challenge or something new like Iron Viz. And when things didn’t work out how I originally envisioned, I finally felt okay to just throw my hands up, laugh at Tableau, and find the joy in it all.
I think that is my favorite thing about #DataFam. Interwoven within this tech community are these random acts of kindness from (essentially) strangers. A random tweet on your timeline can be a total gamechanger. It means a lot, and it’s something I have come to treasure quite a bit in 2020. What a gift!
Eric Balash (United States)

Twitter | LinkedIn | Blog or Website
I’d like to call out my main dude, Jeff Plattner! Jeff and I have really grown together over the past year. We both took new jobs in the middle of CoVID, we both took on the journey of printing vizzes, and we share a similar love of sports data. Jeff is an amazing person who is extremely supportive and always goes the extra mile to help someone else. On top of taking care of his family and starting a new job, Jeff is always willing to lend a helping hand to someone who needs it. During CoVID, Jeff and I chatted regularly about this, that, and anything and he truly is a representation of what the #datafam is. I’m happy to call him a friend and want to thank him for the company and support during 2020.
Eva Murray (England)

Twitter | LinkedIn | Blog or Website
Michelle Frayman continues to inspire me and I feel fortunate to have her as a friend. Michelle is quietly achieving fantastic things and watching her progress with Tableau and in the data visualization community over the last two years has been hugely rewarding.
Michelle exemplifies what it means to contribute, learn, and grow. She takes on feedback from others and makes the most of it, which, as a ‘feedback giver’, is really helpful for my own motivation to continue doing this.
Eve Thomas (England)

Twitter | LinkedIn | Blog or Website
Over the past year, I have been inspired by many people within the data community. My Tableau journey started just over a year ago when Luke Stoughton (@barnsleybeast) encouraged me to apply to Data School UK— if you had told me 5 years ago that at the ripe old age of 27 that I would be embarking on a complete career change in data, I would have said you were off your rocker, but I can safely say it was the best decision I ever made!
The Information Lab (fronted by Tom Brown (@_tombrown) and amazing head coaches Andy Kriebel (@VizWizBi) and Carl Allchin (@Datajedininja) has a culture of personal and professional development where you’re continually inspired to learn and improve. Everyone is willing to support you in both your work and personal projects, and so I would like to take this opportunity to thank the amazing people that make The Information Lab such a great place to work.
My second source of inspiration is of course the incredible online community. There are so many people who pour hours into running inspirational community projects such as #MakeoverMonday #SGDProject #ProjectHealthvViz and #IronQuest (Just to name a few!). Their passion, as well as the support they offer both in terms of encouraging participation, and giving valuable feedback, has given me the motivation to create and share my work with others. They have also inspired me to start the #Viz2educate initiative alongside Vinodh Kumar V R (@VinodhDataArt), which aims to provide free educational resources for teachers and students across the globe.
Fi Gordon (Australia)

Twitter | LinkedIn | Blog or Website
Fred Najjar reached out for help with a viz review for a passion project he was collaborating with Soha Elghany: The Day Lebanon Changed. We poured over the viz, they’d done an outstanding job of using colour effectively (which is a passion of mine). Reading through the story, I was brought to tears. It doesn’t happen often, but gee whiz — it’s magic when it does! It’s truly amazing how a visualisation that is composed with an excellent storyline can really hit you. The pair were awarded #VOTD, for me, it is #VOTY (link).
Frederic Fery (Australia)

Twitter | LinkedIn | Blog or Website
My inspirations in 2020 were…
- Wendy Shijia for her designs
- The Flerlage brothers and Toan Hoang for their technical mastery
- Thi Ho, Katie Gilroy or Satoshi Ganeko for their ongoing commitment to the Viz For Social Good cause (plus many more volunteers)
Ghafar Shah (United States)

Twitter | LinkedIn | Blog or Website
Editor’s Note: Ghafar covered his response with his 1st blog post below.
Heidi Kalbe (Germany)

Twitter | LinkedIn | Blog or Website
This year the world really came together. When traveling still was possible, Alex Waleczek hosted me in his Auckland, NZ home, and showed me around the North Island. When my travel plans were impacted by COVID and I had to self-isolate for two weeks, Chris McClellan took me into his home near Sydney, AUS — safely physically distanced, but socially connected. (And there were alpacas! Best quarantine experience ever!)
Back in Germany, going virtual helped really kick off our Data+Women efforts. I learned that when you reach out to the DataFam, people will say Yes rather than No nine times out of ten. This allowed me to bring in fantastic speakers from all over the world, such as Sarah Bartlett, Emily Kund, Lena Reick, and Daria Voronova. Sarah’s talk especially motivated one of our D+W attendees to get Tableau certified — that definitely brought a smile to my face. It’s a fantastic feeling to offer a platform that helps encourage, inspire, and empower members of the DataFam.
And Kevin Flerlage’s video series of disgusting things to eat while COVID had deactivated his taste buds infused some much-needed humour into a very serious global situation.
Hemal Sheth (India)

Twitter | LinkedIn | Blog or Website
This year (2020), I decided to participate actively in MakoverMonday, social community projects like VizforSocialGood, and other storytelling with data projects. It is helping me tremendously in shaping my data analysis, visualization, and design skills. My source of inspiration comes from Tableau Zen Masters, Ambassadors, Authors, and fellow community members. I thank all of them who are my learning resources.
Hunter Hansen (United States)
Twitter | LinkedIn | Blog or Website
Can I share two short stories? Yes. Yes, I can.
The first is from Bo McCready, now an extended peer at work — who makes a habit of topping r/dataisbeautiful with his vizzes. At my worst, I lament that I took a road that I thought would be easier in college — and it was: double majoring in English/History to avoid having to take maths. Some days I regret that.
But when I saw that Bo also majored in Liberal Arts areas for the same maths-avoidance reasons, I’ve pocketed that tidbit for when I’m down in the data. My journey is my own, and it’s very unique, but it’s not lonely — I appreciate the others who’ve blazed similar trails and leave me paths more clear.
The second was when I woke up to a Sr. Product Manager sharing one of my YouTube videos, when I shared my uniquely autistic experience attending Tableau Conference-ish ’20. Her words were touching and far-reaching for the neurodiversity advocacy cause, showing me that it is far more embedded in many datafam levels than I ever know. She even tagged Tableau’s board, CEO, and other execs, which was kind — I know that they have better YouTube videos to watch, but the gesture meant a lot.
Ioana Rusu (Romania)
Twitter | LinkedIn | Blog or Website
In January 2020 I decided to work more with Tableau. I felt like I was not doing enough at work and had to grow my skills.
I searched on Google and found #MakeoverMonday community. I remember my first submission, on 22nd of January 2020, not my finest piece of work. I kept participating and got inspired by people in the community, their work, and the feedback that I have received! Fast forward to October 2020… I feel like my skills have improved so much, I am now able to create clean and simple dashboards. When I created my ‘Working from home’ dashboard, I did not expect to have 2 people favourited it, this goes to show that the community is amazing and the feedback it’s paying off!
I have ‘met’ some amazing people in the #datafam community and I have to thank Michelle Frayman(@maf2k) in particular because she pointed me to Figma and this tool helps me so much when creating my dashboards.
I am grateful for connecting with Sergiu Rotaru(@SergiuRotaru6) and Madalina Andrei(@madalinaAndrei_) who encouraged me in both English and Romanian that my work is improving and because of them, I started to participate in #RomanianDATA.
I really feel the community is great! Thank you everyone for your feedback!
Iram Javed (Australia)

Twitter | LinkedIn | Blog or Website
There is absolutely no place other than datafam and everyone in the community is super supportive, kind, and encouraging. Although it is very hard to select a few names, here are a few of the people who have inspired and encouraged me:
Eva Murray — Whenever I see her viz reviews I get impressed with the efforts she puts in for the community. There is so much to learn from her feedback, I personally have learned a lot from her review sessions. She is such an inspiration.
Sarah Bartlett — She was the first person who tagged me with TableauFF last year. I was over the moon, felt special, and noticed. I don’t think Sarah has missed any week in recognizing and appreciating new community members. Thanks for being so awesome.
Simon Beaumont — has been so kind as to provide me feedback on my vizzes. There is so much to learn from him.
Thi Ho — I don’t think I know anyone as kind as Thi :) She always been a super supportive, encouraging, and caring member of the community.
Swati Dave — she is such a good friend; a go-to person to ask anything I have in my mind.
Adam Mico — He has always guided and encouraged me and reassured me at many places when I was in doubt. Thanks for being there.
JR Copreros (Canada)

Twitter | LinkedIn | Blog or Website
2020 was a year of transition for my family and me. We had just relocated from half-way across the world earlier in the year to be closer to home, and the timing could not have been any better in light of what would transpire across the world only a few weeks after. Despite how challenging the past months have been as a result of the lockdowns, I count myself blessed to have not only discovered an outlet from creative expression through data viz but to have also found such a supportive and inspiring online community that is the #DataFam. I truly believe this community as a collective is 1-of-1, as I continue to feel inspired, supported, challenged, and encouraged to grow as a result of the new friendships I’ve gained in the past months. A lot of you have truly positively impacted me either directly or indirectly and for that, I’ll be ever grateful (a special shoutout to Kevin Flerlage who has been both a mentor and a friend from my early days — your feedback, support, and encouragement has truly been appreciated). Looking ahead, I am super excited as we continue to spur one another as a collective towards excellence and just all-around good vibes. You all rock — my sincerest thanks again and much love!
Jacqui Moore (United States)

Twitter | LinkedIn | Blog or Website
The DataFam has so many amazing people who have inspired me, too many really to name, but there are a few who have made an impact on me this year.
First, I have to talk about the #MomsWhoViz group. This amazing group of moms talks nearly every day. We talk about data visualization, we give each other feedback, we celebrate each other’s successes and lift each other, and push each other when we need it. We talk about work struggles, parenting struggles, how we work from home or avoid distraction, and chit chat about things that are happening in our lives and around us. It’s a bright spot for me. We have data visualization and parenthood in common, but we are all over the world working in different areas. Johanne Lemaire wrote much more articulately about this group, so I will leave it at that, and defer to her much more eloquent writing. 😊
Second, I joined the Boston TUG and #TheSDGVizProject this year as a co-lead. My fellow co-leads, members, and participants keep me inspired to be involved and to keep giving back to the community regularly. I have met so many wonderful friends through these groups. I can’t recommend enough joining a project or being active in a TUG.
Finally, I have to give a shout out to Autumn Battani. She is new to the DataFam, but she has been a wonderful addition, with her inspiring work, her kind words when she reaches out to her open personality and her amazing DataFam Murder Mystery which kept us all busy for a week!
This barely touches on the friendships and inspiration in this community, who after numerous Zoom game nights, DMs, and Twitter conversations, feel closer than ever before because we’ve really connected so much more this year than ever before. I can’t wait to see everyone in person again, but staying connected to the DataFam virtually has helped me keep my sanity and stay inspired through the ups and downs that 2020 brought.
Jasmine Lim (Malaysia)

Twitter | LinkedIn | Blog or Website
I only started my journey with Tableau Public in June 2020 during the movement control period in my hometown. Being a newbie to the community, I’m very thankful to Adam Mico. Adam is the first one who shares my work and welcomes me to the community, making me feeling warmed! Adam also got the Michael W. Cristiani Community Leadership Award this year. Congratulations again Adam, really well-deserved!
I have also worked with Ghafar Shah this year, he’s my mentor in the Mentoring Meetup project! Ghafar is so kind in giving feedback to my work, helping me to grow and do better. Ghafar inspires me a lot in my Tableau Public journey and I’m overwhelmed with happiness when Ghafar is awarded the Biggest Growth Vizzie Award this year. Continue your great work, Ghafar!
I love the positives vibes and the amazing work from the datafam community. Even though the CoVID-19 pandemic tears us apart, this community makes us stay connected. Thanks datafam for the contribution and inspiration in the whole year of 2020!
Jason Browning (United States)

I am inspired by the Flerlage Twins, Kevin and Ken, and their level of commitment to the Tableau community. They have shared so much of their knowledge through their Twitter postings, blogs, and guidance. This open sharing and frequent communication help to assimilate others into the data community and make them feel welcome. Also, as I’ve worked with Tableau for a number of years, they continually impress me with new tips and tricks that I did not know and continue to make my job easier and expand my skills. They exemplify the selfless and welcoming nature of the #datafam and make me proud to be a part of the community.
Jeff Plattner (United States)
Twitter | LinkedIn | Blog or Website
On October 22nd, my dad went in for open-heart surgery. After some tests on Monday the 19th he had been sent home where he was contacted the next day by the surgeon he had been referred to by a friend. The surgeon, who was not present for the Monday tests, told my mom and dad to come to the hospital as soon as they could because my dad needed surgery right away. She said, if she had been the one reviewing the tests, she never would have sent my dad home. Hearing this unfortunate news from my mom scared the hell out of me. I was several hours away from my parents, didn’t know how serious my dad’s issue was or what to expect, so naturally, I began fearing the worst possible outcomes of my dad’s surgery. Wednesday was a difficult day, as I constantly thought about my dad, but was unable to connect with my mom or him since they were in the hospital with a lot going on. Now and then I would get overwhelmed and could not hold back the tears. By Wednesday night, I had learned the surgeon who would perform my dad’s surgery was one of the very best in the country. I stalked her on the Sanford Health website and felt a tiny bit better after reading many glowing reviews. My dad’s surgery was scheduled to begin between 1–2 pm on Thursday, October 22nd. That’s where the datafam comes into the story. That morning, I went back and forth for a while on whether or not to post anything about it on Twitter, as I didn’t want to come off as someone seeking attention. But, I finally decided “what the heck,” as I was still quite worried about the whole situation and in need of any positive vibes/thoughts that might be sent our way. After sending out my tweet, I was completely blown away by the datafam’s response.
I didn’t expect to receive so many kind messages, DM’s and text messages letting me know the datafam was thinking of and praying for my dad and our family. They truly helped me get through the day and I want to take this opportunity to say “THANK YOU!!” It meant so much to have that support.
I drove to Fargo, ND to visit my dad in the hospital the Saturday after his surgery. He was still a bit out of it from all the pain meds, but it was so great to see him, especially given the fact that we’ve only seen my parents once since March, because of CoVID. I stayed the night at a nearby hotel and went back in the morning to see him again before heading home. Much to my surprise, the surgeon said he was ready to go home that day, just 2 1/2 days after his surgery!! He’s been at home recovering and is doing well, although he’s bummed to be missing out on deer hunting for the first time in nearly a half-century, as well as missing out on a season of ice fishing.
Again, thank you to everyone who helped get me through the day of my dad’s open-heart surgery. Your thoughts and prayers were greatly appreciated and very much needed.
Jeffrey Shaffer (United States)

Twitter | LinkedIn | Blog or Website
This year it’s been exciting to see the launch of Her Data. Dinushki De Livera and Jennifer Dawes have been very busy this year setting it up, blogging, vizzing, and interviewing. They have been interviewing some great voices in the community that we might not otherwise hear from.
In addition, I have the privilege of working with them on my team. They always bring great energy to our online calls. No matter the situation, they always lift the spirit of the group.
Jennifer Dawes (United States)

I am constantly inspired by the Tableau community. I recently made the switch from a career in HR to a career in data visualization. The switch was intimidating at first as it was such a large leap of faith for me. First and foremost, I am beyond grateful for the continued support from my team at Unifund, Dinushki De Livera, and Kevin Flerlage. I can not say enough about how much I appreciate their encouragement. Dinushki and I have worked together for 4 years now and she was a key person in helping me take the leap. Every day I get to work with people I truly enjoy.
This year, Dinushki and I launched herdata.net. We have had the ultimate pleasure of talking with and getting to know so many amazing people in the Tableau Community from Emily De Padua, Wendy Shijia, Autumn Battani, Christian Felix, and Priyanka Dohbal to name a few. I have worked in various industries and corporate cultures not everyone is always willing to extend a hand to help those around them grow and develop as well. I look forward to 2021 and can’t wait to see what else comes.
Jim Dehner (United States)

Twitter | LinkedIn | Blog or Website
Ken and Kevin have been such an inspiration to all of us in the Community — yet on a personal note Ken has been my mentor helping me get started blogging and both Ken and Kevin have been supportive — review a draft post, helping me think through different approaches to a problem, speaking and allowing me to speak at TUGs and the Community Jam Fest– can’t thank them enough!!!
Johanne Lemaire (Canada)

Twitter | LinkedIn | Blog or Website
My story about a group of people in the #datafam who continue to inspire me in 2020 and what that means to me
What I love most about the #datafam? I am not sure it can fit into a blog post, never mind an intro paragraph. I love how supportive and helpful and welcoming people are in this community. So, specifically in 2020, who has inspired me most in the community?
The group that has most inspired me and keeps inspiring me on a daily basis are the working moms who come together in the #momswhoviz group. The group is so inspiring to me because the interactions we have via Twitter, email, and Slack are to me exactly how our lives as working moms are: highly disjunct, unordered chunks of the different spheres that touch and somehow manage to fit into those 24 hours that make up one turn around the sun.
We have celebrated outstanding achievements in the dataviz community that included VOTDs, nominees in the Vizzies, Zen Master, Tableau Featured Author, VizConnect, Finalist at Women in Analytics. We have talked about the noise our families make and how we cope with it while working. About school shutdowns, teaching our kids at home, schools reopening in different places around the world. About the ups and downs in our own health and that of our loved ones (remember, women do most of the care-giver work in the world, both of the young as well as of the old, and the fact that we have careers doesn’t mean we don’t do this unpaid work). How to cope with challenges related to CoVID. Yes, of course, we also give each other feedback and ask questions about data visualization. And we celebrate each other and lift each other up.
The power of the group is our diversity: yes, we all have kids, and yes, we all work with Tableau. Beyond that, we live in different parts of the world, we work in different industries — I find our exchanges extremely enriching because of diversity.
Oh, and just in case any working mom out there in Tableau and dataviz land is wondering: we are _not_ a closed club, please contact any one of us, we’d love to have you!
This list of absolutely great lifter-uppers and vizzing moms is not complete but gives a quick snapshot of this community: Agata Ketterick, Anna Kisting, Bridget Cogley, Christina Gorga, Jacqui Moore, Katie Poznanksi- Ring, Kimly Scott, Lindsay Betzendahl, Michelle Frayman, Swati Dave.
John Whitmer (United States)

Twitter | LinkedIn | Blog or Website
The people who have inspired me the most on my Tableau journey are my local Tableau User Group, the Boston TUG (@BostonTUG). I am very fortunate to live in an area with so many talented Tableau users. However, their technical skills are only surpassed by their incredible kindness and inclusiveness. The way they instantly welcomed me into their close-knit community has always been a source of inspiration for me and my #1 example of what the hashtag #datafam means.
For me, all of this started with the promise of free beer. My first TUG event was Chart Champ, a great event hosted each year by ClearTelligence. It was a full day of technical demos and design presentations at Harpoon Brewery and as a Tableau newbie, it was VERY overwhelming. I was content sitting at the bar, just soaking it all in (both beer and knowledge). As I was about to leave, I was joined at the bar by Pam Okerholm (@JustPeachie05). We had a great talk, about everything from Tableau to riding horses, and it was immediately obvious that I had made my first Tableau friend. Afterward, she introduced me to our TUG Lead Will Strouse (@dataNOTdoctrine) and so many others who continue to be my closest “fam” members to this day.
Fast forward to today, I am so happy to be one of the Co-Leads of the fantastic Boston TUG team. Together with Will, Dustin Cabral (@Dustiboy21), Brian (@BMooreWasTaken), & Jacqui (@jaxx084) Moore, I am honored to now be the person working the room and looking for that person who, if just given a little nudge and encouragement, could be that next great friend and contributor to the Tableau community.
Judit Bekker (Hungary)

Twitter | LinkedIn | Blog or Website
I’m gonna share a bunch of people who inspired me recently and who — to me — are dataviz goals. Adam Green — he’s the only person who could do a viz in black and white using red. Zach Bowders — how does he get these crazy ideas and when does he sleep? Autumn Battani — she’s one of the strongest glues within the community, an American Sarah Bartlett. Wendy Shijia — if maps were chess, she’d be a grandmaster. Tamás Varga — I’d spend 5 days putting together anything he publishes for Makeover Monday ON MONDAY.
Jyoti Lunaych (Australia)

Twitter| LinkedIn | Blog or Website
My introduction to awesome #datafam on Twitter started thanks to Mark Connolly and Alexander Waleczek with whom I connected separately on LinkedIn when I was looking to get to know some tableau professionals and in the process learn from them. I had separate conversations with Mark and Alex, but there were a couple of common suggestions. One was to maybe get started with #MakeoverMonday if I’m looking for a platform to practice more Tableau Visualizations. And the second suggestion included the recommendation to join the very vibrant and supportive #datafam community on Twitter.
I took up the suggestions and a couple of weeks later made my first Tableau visualization and shared it on Twitter as well. Alex was very kind enough to praise and retweet my viz, and since then the support and engagement from the community has been absolutely heart-warming and inspiring. Sarah Bartlett and Adam Mico played a major part and helped me reach/engage with more community members. I instantly felt welcomed and like being a part of the community. And since then there has been no looking back and there’s so much that I’ve gained from datafam in terms of learning and getting to know incredible people working with tableau.
It’s thanks to the datafam that so many of us get a platform to engage, get support, inspiration, and feedback. We get introduced to new blogs and techniques that are shared from time to time. The incredible community projects provide a platform for everyone to practice or experiment with their skills as per their area of interest. And I love the fact that Tableau Legends including Zen masters are so approachable here. I always found them ready to engage and help. I don’t think this would’ve been possible anywhere else. Or if it is, maybe I’m just not aware! :)
There’s so much more that still stands out to me and helped me immensely in my journey, but I’m aware that my write-up is getting pretty big and if I write any more, it may just get skimmed over in this long list of blogs. I will nonetheless like to say special thanks to #MentoringMeetup Initiative through which I met Sarah Bartlett as my mentor. Also a very special thanks to Sarah for taking out the time and sharing with me some wonderful resources, advice, and feedback on my visualization. She is a guiding light in the community and I consider myself incredibly lucky to be her mentee. So Thank you so much, Sarah!
Kamaldeep Singh (Australia)

Twitter | LinkedIn |Blog or Website
When I created my first visualisation I was not familiar with the Tableau community. Later on when I came to know about the datafam community then it truly amazed me. Tableau community is always there to help, support and provide feedback. I want to mention Priya Padham, who always replies to my queries. Special thanks to Adam Mico, whom I approached to assign a mentor so that I can improve my skills further and he then assigned Akash Sengupta as my mentor. I am learning and improving through this mentor-mentee relationship. I love exploring visualisation produced by fellow Tableau lovers and learn a lot through their amazing visualisation. So, Thank you to everyone who publishes, comments, tweets and shares their knowledge with the public, keep doing the great work. It’s helping and making at least one person smile.
Karen Hinson (United States)

This has been an incredibly tough year for me. I have struggled to juggle working full time from home with four young children. SO many data friends have reached out to me, showing genuine concern and offering support and encouragement. I am particularly grateful for my good buddy and ATUG comrade, Nelson Davis (a great listener, advice-giver, and the type of friend anyone would be lucky to have). In moments when I felt particularly overwhelmed with family, work, and homeschool and didn’t know how I would possibly manage any additional responsibilities, he always had my back. Leading a Tableau User Group probably wouldn’t be possible for someone like me (during this season of life & under these circumstances), were it not for people like Nelson. 😊
Kate Brown (United States)

Twitter | LinkedIn | Blog or Website
I was over the moon that Ghafar Shah won the “Biggest Growth” Vizzie Award. I met Ghafar when he was interning at Comcast. He took the initiative to set up conversations with me about data and Tableau and it was clear then that Ghafar was serious about learning as much as he could from a wide range of people. We have kept in touch since then and I’ve probably learned more from Ghafar than he has learned from me. It has been wonderful to watch Ghafar’s skills, career, and confidence grow and I cannot wait to see where he goes next. I love seeing good hard-working people get recognition and thanks to everyone who nominated Ghafar for this Vizzie.
Katie Kilroy (Ireland)

Twitter | LinkedIn | Blog or Website
So many folks in the Tableau Community inspired me throughout 2020 in numerous ways. Let’s be honest — 2020 has been a year like no other for many of us. Despite that, it was encouraging to see people cranking out blog posts and vizzes, enthusiastically joining virtual meet-ups, participating in feedback, welcoming new names and faces, engaging in conversations, starting new blogs, and essentially giving their time, expertise, and friendship… all while the 2020-crazy rumbled away in the background. Well done, Tableau Community!
Katie Wagner (United States)

Twitter | LinkedIn | Blog or Website
The way that our datafam came together during the global pandemic to host virtual TUGs is really inspiring to me. It reminded me that I can “see” people more than just once a year at the Tableau Conference. It encouraged me to reach out to some for advice, whom I didn’t want to bother because they were “too far away”.
Ken Flerlage (United States)

Twitter | LinkedIn | Blog or Website
If you haven’t seen the work of Judit Bekker, then stop what you’re doing right now and go look at her Tableau Public page. Judit is a Data Visualization Expert with Starschema Ltd, based in Budapest, Hungary. She came onto the Tableau scene in 2020 and really wowed us all right away. She has an amazing talent for pairing relatively simple visuals with phenomenal design to tell a very compelling data-driven story. While I consider myself a pretty good designer, her work just blew me away and has been a huge inspiration to me. Over the course of the year, I’ve learned so much from her and I’ve repeatedly used her tips and tricks to improve my own designs. You can see her inspiration in my work as well as dozens of other people who are creating amazing visualizations. She’s had a huge impact on the Tableau community in 2020 and I expect we’ll continue to see her influence grow in 2021.
Kevin Flerlage (United States)

Twitter | LinkedIn | Blog or Website
I am inspired by the incredible Community Team at Tableau. Andrew, Amanda, Jordan, and so many others always work so hard to make us all feel so welcome, engaged, and important. They helped to bring what we all love about the Tableau Conference, community, to life during a virtual conference. I can’t say enough about this incredible team! Thank you, Tableau.
Klaus Schulte (Germany)

Twitter | LinkedIn | Blog or Website
2020 will go down in history as the year when the Corona Pandemic hit us all. The visualization of health data had never been a special focus of mine, this year I really couldn’t avoid dealing with it in more detail. I’ve learned a lot from the work of Amanda Makulec and Bridget Cogley. The visualization of health data is about much more than just presenting facts and figures. Amanda lists the hashtag #VizResponsibly in her Twitter bio, and Bridget mentions #DataEthics in hers. Amanda’s and Bridget’s blogs and talks on these topics have been so inspiring throughout the year. I’ve been trying to take their works and recommendations into account in my own projects and passing it on to my students in my lectures. Thanks for bringing these important topics closer to me and our community!
Kyle Yetter (United States)

Twitter | LinkedIn | Blog or Website
Some of the greatest days of 2020 for me were spending time, albeit virtually, with the DataFam during TC20. Thanks to Zoom hangout sessions with the Flerlage twins, Emily Kund, and the APAC crew, I felt like I got some of the connection I thought I was going to miss from not attending the conference. Each of the hangouts I participated in brought a smile to my face, none more than Andy Cotgreave somehow knowing the card I would pick from across the ocean!
It seems like forever ago that Maria Brock published The Tableau Student Guide, but it was in February of this year. The amount of effort Maria put into creating this guide for students and other beginners to Tableau was truly inspiring. It was such a great example to me of what the DataFam is about, sharing what we know and have learned to help the next person be that much better.
Lindsay Betzendahl (United States)

Twitter | LinkedIn | Blog or Website
This year has been more than challenging for many of us. But as we round out the end of the year, I can reflect on how supportive the #datafam is and how lucky we are to have each other during this crazy time.
The past few months were hard. I struggled emotionally and mentally for a number of months and was less involved in the #datafam community due to the pressures of having kids home, working multiple jobs, and feeling isolated and anxious about the state of my family. A flood in our house caused 3 floors worth of damage at the end of the summer and I near lost it. Despite the ups and downs, there have been many people who have been there to help ride out the waves of 2020 and I’m so thankful for all the smiles you have given me!
First, the #momswhoviz community has been stellar in maintaining hope and laughter for me this year. I started the community of a few people in late 2018 after feeling like being a mother in a highly demanding, often male-dominated data viz field had a number of unique challenges and I wanted to connect with others who could relate. Since then, the community has grown and we connect and talk daily. It’s a place to share parenting stories, get advice, give and receive data viz feedback, and so much more. This group of fantastic mothers has been a huge source of support and hope. I’m so thankful to have a group of friends around the world that I can open up to and who is always there to help out. I cannot name everyone but, thank you to Michelle Frayman, Jacqui Moore, Agata Ketterick, Karen Hinson, Johanne Lemarie, Christina Gorga, Anna Kisting, and Sarah Bartlett. You ladies rock!
Secondly, during the beginning of COVID, some people started #datafam game night where virtually a group of people could play games over Zoom together. These regular meetups were so fun and uplifting. It was a blast to get together virtually, laugh, and play games as if we were all sitting together at someone’s house. It was such a fun way to break up the time spent in quarantine. This group was also instrumental in keeping me in good spirits this year and I cannot thank them enough for their generosity and kindness. Tim Cady, Luigi Cicciari, Kevin Flerlage, Christina Gorga, Michelle Frayman, Jacqui and Brian Moore, Will Strouse, Will Perkins, Adam Mico, Jeff Plattner, Paul Rossman, and Andy Piper — from the bottom of my heart thank you! And thank you to Will Perkins and Vince Baumel for your constant GIFs that literally bring me to tears. LOL. Laughter is the best medicine, for sure.
As I look towards a more promising 2021, I want to remind everyone that this Tableau community is here for you in whatever way you need in data viz and beyond. It’s truly the greatest group of friends. I cannot wait to be able to see you all in person again!! But until then stay safe, keep in touch, and keep being the awesome people that you all are!
Lorna Brown (England)

Having close connections with many of the DataFam community has been a real blessing over 2020. But especially working closely with the WOW2020 team and Andy Kriebel for Tips. The DataFamCommunityJam hosted by Emily Kund, Kevin Flerlage, Sarah Bartlett, Alex Waleczek, Jordan Scott, and I have been a real success for 2020 and kept the community together.
In a more general term, all of the virtual meet-ups and get-togethers have been fantastic. I know 2020 has been an incredibly tough year for everyone, I hope 2021 is a better year, but because of the lessons learnt in 2020, we can be a lot more connected than we have ever been!
I hope you all are staying safe and well, and if you are feeling a little down in the dumps, reach out my inbox is always open!
Lots of Love
Lorna x
Luigi Cicciari (United States)

Twitter | LinkedIn | Blog or Website
2020 was supposed to be a great year. It is a leap year that normally leads to the Leap Day celebration at Disneyland. You know, the “happiest place on earth.” We had plans to go to Sicily for a week, meet our newborn nephew in Nuremberg, and spend some time in London during Tableau Europe. We had a wonderful year planned. In 1937 John Steinbeck already had an answer for our plans: “The best-laid plans of mice and men / Go oft awry.” Well, we all know how the year has turned out to be — pure rubbish! It has been tough on all of us in a multitude of ways. Through it all I have been able to get through with my family (my wife Nicola, my twins Filippo and Gabriella, and my doggie Leila) and my #Datafam. I can go on and on about how much my personal family means to me. However, this is a blog about the #datafam community.
It cannot be overstated how wonderful the community is. They are there for each other in the best of times and in the worst of times. Over the last year, I have a countless number of people who have been there for me and have brought a smile to my face. There is one group I would like to call out for this blog — our Datafam Game Night group. It’s a ragtag group of Tableau enthusiasts and wonderful people who joined together to initially hang out and play some online games. At the very beginning of the CoVID times we’d meet up virtually every few weeks and play games like Quiplash, Fibbage, Cards Against Humanity, and much much more. Even in some very stressful times, It was a chance to just be and to laugh.
Over time the group has evolved. We still get together for game nights, although less frequently. It has grown to be much more than just games. It is a continuing chat among friends. True friends. #Datafam. Topics range from personal difficulties and triumph, personal playlists and mixtapes, some very good and very bad jokes, and other witty banter. If there is any positive that can come from a pandemic, it would be the friendships that have been strengthened during these times. I cannot imagine not having these people in my life.
Luther Flagstad (United States)

Twitter | LinkedIn | Blog or Website
I joined the datafam in March 2020 when I set up Twitter. Over these past eight months, there have been many people who have been incredibly welcoming and supportive. In no particular order, the following people have meant a lot to me: Adam Mico, Marc Reid, Sam Parsons, Eva Murray, Charlie Hutcheson, Luke Stanke, Will Perkins, Autumn Battani, Pavneet Singh, and CJ Meyers.
But the person who most exemplifies the datafam to me personally is Shivam Mittal. His early and constant support of my work has been enormously encouraging and has added the fuel for me to keep at it week by week. I wouldn’t be here without his friendship in the datafam. Thank you, Shivam!
M Lakshmi Kameshwara Abhijeeth (India)

Ravi Kumar N inspired Me, in believing Me when We both met Pawan Sachdeva during TC2020 in a Braindate. Though I was away for about 5 months on Makeover Monday. They both saw great potential in Me and I started to believe in Myself first even though I wasn’t, at first. This little appreciation had given me much needed the inspiration to fuel my desire to succeed.
Mala Deep (Nepal)

Twitter | LinkedIn | Blog or Website
As I first got my Tableau from Student License, I was overwhelmed by learning it. I started looking on YouTube for tutorials and so on, but I was all doing the silos. Then, luckily I stumble on #MakeoverMonday, data.world, and from there, I saw #datafam Twitter. Then I created my Twitter account to connect with #datafam. I started exploring the experts in the #datafam family. I never forget the day I was trying to learn formatting in Tableau, I got stuck, and I message Dzifa Amexo (@datadzif). After some hours, she replied with a quick short self-made video, which impressed me by seeing her zeal to share her knowledge with a neophyte like me. Also, other people never hesitate to address my queries. If I start to name them, I think I might fill the blog myself.
Joining Twitter, seeing the zeal of #datafam people to support neophyte (or anyone) without holding the proudness of being expertise, made me feel proud of being part of Tableau community.
Mark Bradbourne (United States)

This may be a cop-out of an answer, but the community as a whole has helped and inspired me this year. From Adam and Vinodh reinvigorating Mentoring Meetup, to all the new amazing authors being feature by Tableau Public. To Zach Bowders who continues to be a bright light in the Datafam and pushing me to my new podcast. To Emily Kund, Kevin Flerlage, and the rest of the crew who executed the DataFamCommunityJam. To the Tableau Community Team (Amanda, Alyssa, Rasta, Jordan, and all the others) who continue to look for ways to improve the community and who helped move our amazing TUG ecosystem into the virtual world. To Tableau who pulled off an amazing TC-ish! Even in the darkest days and toughest situations, the Datafam continues to amaze and inspire.
Mark Connolly (United States)

Twitter | LinkedIn | Blog or Website
Lindsay Betzendahl, Simon Beaumont, and Nicole Lohr get my shout-out here! Our analytics team was looking at how we could best clean up and implement an Active Directory to support our Tableau Server. Since these three are my go-to’s, I sent them a message a few months ago asking if they had any pointers before our team started work. Not only did they respond — all three of them offered to meet virtually and really go through their experience with this and highlighted a few key lessons learned. Beyond the fact it was great just to chat with them, the call we had was incredibly helpful for me. This is just one short and sweet story of the three of them but I know they are constantly giving back and engaging with our community. Simply caring and great people I can’t say enough about!
Meetali Pandey (India)

Twitter | LinkedIn | Blog or Website
- Naveen Bandla
Twitter | LinkedIn
He is great inside /out, always inspiring, motivator, helpful, and very humble. You always learn something new from him. Thanks for being such a great asset to the community as well as to mankind. Words cannot describe him. - Sumeet Bedekar
Twitter | LinkedIn
He is someone who motivates you and pushes you to try new things. Very Positive, helpful, humble, and inspiring person. - Apart from the above mentioned, I truly respect and appreciate all the #datafam members, they are doing such great work which is very helpful and inspiring for the community. So a big thanks to all of you.
I feel blessed to be a part of this.
Michael Summons (United States)

Twitter | LinkedIn | Blog or Website
I was inspired and challenged by the ENTIRE datafam in many different ways. I was first inspired by the level of knowledge sharing within the group as well as the amount of creativity used in published examples. The beauty of the datafam community is that everyone brings a completely different aspect from which to draw inspiration. Seeing what others were doing made me want to explore the abilities of Tableau and test boundaries to see what I could do differently with regards to data visualization. In doing so I was able to challenge myself to think outside the box with the intent to create visually different but still be able to tell a story with data. I’m extremely thankful for my experience within the datafam community and encourage others with an interest in data visualization to become active and involved.
Michelle Frayman (United States)

I always enjoy engaging with the broader #datafam community but there are the groups that have lifted me up and sustained me over the last few years and 2020 in particular.
Community Projects
One of my favorite parts of participating in community projects like #MakeoverMonday, #IronQuest, and #ProjectHealthViz is the opportunity to interact with new members of the community as well as people who have been around for a while. It is an easy way to meet new people and provide encouragement. A little comment here and there or the like can go a long way to helping someone feel a part of things and keep them motivated. It has meant the world to me to have met so many people all across the world through these projects. I have made great friends through these efforts and I really appreciate everyone who puts their time into running them.
#MomsWhoViz
I can’t list everyone and I hate to leave anyone out but a big shout-out goes to all the #MomsWhoViz out there. We have each other’s backs and support each other when it all gets to be too much. It has been amazing to connect to other women who are in similar situations, ones I have been through before, ones I will no doubt get to in the future, etc. We provide feedback, professional and personal support, and lots of love to each other. We’ve navigated job searches, career advancement, homeschooling, healthy eating, viz review and tips, and a host of other topics across the random craziness of life with kids.
Small-Group Chats
These have allowed me to get to know a smaller group of people more deeply. One grew out of a mutual love of games and a need to find creative ways to connect since we were all at home more. Another grew from concerted efforts to gather a diverse group of people together. And a third from a collection of people recognized at the same time who have been inspired by a leader to stay connected. Each of these is special in its own unique way.
Boston Tableau User Group
Last but certainly not least the @BostonTUG inspired me.
We absolutely have the best TUG and my hometown peeps are awesome. I miss everyone since we cannot gather in person but love that we have stayed connected despite everything.
Mohit Panse (India)

Twitter | LinkedIn | Blog or Website
Tableau Public Authors’ have inspired me in 2020.
This title is more than enough to start a conversation with anyone who is using Tableau at a novice/professional level. I always re-engineer and learn from all those fantastic visualisations :)
From simple, elegant & informative to complex, stunning & fun vizzes; these authors help us to learn how we can push our Tableau limits! In fact, I would like to coin it as ‘Tableau Viz Catalogue’ :)
Few names who have been an inspiration to me:
- Pradeep Kumar G
- Sam Parsons
- Pawan Sachdeva
- Priyanka Dobhal
- Michelle Frayman
- Dzifa Amexo
- Adam Mico
- Cole Knaflic
- Swagat Kumar Jena
Creating a strong Tableau Public profile has helped me to land a job this year in USEReady; a place where all the colleagues are very supportive and help each other to learn and grow together 🙂
I am very thankful to all those mentors who are running the following wonderful #datafam communities:
- #MakeoverMonday
- #WOW (Workout Wednesdays)
- #SWD (Storytelling With Data)
I am very happy to be a part of such a wonderful Tableau community and thank you Adam for giving me this opportunity to contribute to this blog!
Mujahed Syed (United States)

Twitter | LinkedIn | Blog or Website
Our datafam is full of helpful, supportive, inspiring, and motivating individuals. As a student, I am so thankful for this incredibly talented and resourceful community. One person in the datafam to whom I owe huge thanks is the lead of the Phoenix Tableau User Group, Michael Perillo. I approached Michael when I received an email from Tableau that said I was being considered as a Student Ambassador Candidate for the 2020 Tableau Ambassador program and the next step was an interview. I was excited when I received this email but as this was my first time being shortlisted for this program I wanted to talk to someone who is already an ambassador and was hoping to get an idea of how to prepare for the interview. So, one day as I was searching for “Tableau Ambassadors” on LinkedIn and Michael’s profile showed up at the top. I sent him a connection request and he accepted my connection request within a couple of hours. I sent him a direct message on LinkedIn told him that I needed a little guidance from him and would like to talk to him about his experience as a Tableau User Group ambassador. He was really kind and agreed to talk to me regarding the same. The conversation I had with him over a phone call helped me get a better understanding of what Tableau Ambassadors do and I felt confident before the interview. A few weeks later, the list of 2020 Tableau Ambassadors was announced and to my surprise, I was recognized as a Tableau Student Ambassador.
I feel that the opportunity to be a Tableau Ambassador while you are still a Student is something really special as I get to interact and collaborate with other Ambassadors, Zen masters and the greater Tableau community. If not for that phone call with Michael, I don’t think I would have been a Tableau Ambassador today. Therefore, I want to thank him for taking time out of his busy schedule and guiding me.
My love for Data Visualization design is never-ending. So I also want to thank my biggest viz inspirations, Priya Padham and Tamas Varga for their beautifully designed vizzes. Their work is something that I will always look up to.
Pahola Diaz (Colombia)

Twitter | LinkedIn | Blog or Website
This year my biggest inspiration from the community has been Rosario Gauna, Kevin Flerlage, and Chantilly Jaggernauth for the excellent work they are doing, the good energy, and the support they gave me when I needed it most. I’m also very happy to have contacted Diego Parker and know that part of his purpose matches with mine, to increase the Spanish-speaking community.
Pat Sarsfield (United States)

Twitter | LinkedIn | Blog or Website
Since I became aware of her, Judit Bekker has served as a constant source of inspiration for me. Her work has helped show me that data visualization can truly be beautiful art. When she mentioned me as #TableauFF in mid-September it was one of the most meaningful moments in my data visualization journey. Any praise is wonderful, but the impact of a few kind words from somebody you respect and whose opinion you hold in high regard is unparalleled. This random act of kindness really inspired me to pass it on and drop my own “happiness bombs” on unsuspecting amazing individuals within the community.
Pawan Sachdeva (India)

Twitter | LinkedIn | Blog or Website
2020 has been an arduous year for almost every one of us but little did I know that this year would be the worst and best for me in so many ways. I joined the Tableau community in January’20 and it has been one of the best decisions I have ever made (Why? You will get to know if you can bear with me for a few more minutes — this is my first blog post)
I started working full time in Tableau just last year, mainly working with text tables and standard charts. At that time, I didn’t know how Tableau and Tableau community would change my life, both personally and professionally. Though I was not connected to the community in 2019, I used to watch VizConnect sessions every week, just for fun. I remember the first two sessions that I watched were of Kevin Flerlage and Adam Mico, the two most amazing people in the community. I got to know about MakeoverMonday (community weekly Viz Project) through VizConnect but never participated back then.
It was just in January 2020, that I hopped on to Tableau Public to seek inspiration for a DataViz competition in our organization. I explored a few profiles — Kevin Flerlage, Pradeep Kumar, and Adam Mico; and was so amazed to see the quality of their work that it inspired me to create a Twitter account at that very moment and take part in MakeoverMonday. I had no expectations or goals as to what I want to achieve (just grow my Tableau skills) and I certainly didn’t know that this is the start of an amazing journey for me.
Reflecting on my journey to date, I would like to express my gratitude to the Tableau Community and my mentor Adam Mico for making this journey so rewarding.
Tableau Community (#Datafam)
When I started with MakeoverMonday, I didn’t know where it would take me and I certainly did not know about the amazing Tableau Community. My first three Vizzes didn’t get much response but for the next one, I got a few good reviews (to my surprise) and feedback from people I didn’t even know. I was so amazed to see how members of the community support each other and explain how you can improve your Viz. That’s when I got my first #TableauFF (Tableau Follow Friday) from Brian Moore wherein he highlighted my profile and gave a warm shout-out. Two weeks later, I got another shout out from Adam Mico and Eric Balash. This was an amazing feeling and I started to feel a part of this amazing and giving community. It is this huge support and warmth of the Tableau community that makes you feel you are a part of this family.
Also, joining the community opened the gateway for a plethora of resources to improve my skills (new techniques from blogs, new chart types, new color schemes). A few blogs that I have used throughout my journey — Flerlage Twins (Kevin and Ken Flerlage), Tableau Magic (Toan Hoang), Sarah Loves Data (Sarah Bartlett), Viz Zen Data (Lindsay Betzendahl), and Adam Mico blogs (Adam Mico).
Being an omnivert, I had a limited group of friends before joining the community (I was confined to my own bubble) but I never thought that apart from improving my Tableau and design skills, I can make great friends all around the globe with whom I can talk about Tableau, personal stuff, cultures or just fun hangouts. I would like to thank all of them for showing their support and encouragement throughout my journey but to name a few — My best friend Adam Mico, Dzifa Amexo, Kevin Flerlage, Ravi Kumar, Ghafar Shah.
Mentorship
My first blog wouldn’t be complete without expressing my gratitude to my mentor and best friend Adam Mico. I recently became a Tableau Public Featured Author (could not have dreamt of becoming one when I joined the community) and I owe this recognition to Adam.
Adam became my mentor in April’20 and working with him made me realize the importance of mentorship in every aspect of our lives. Quoting a line from one of Adam’s blog — “Mentoring helps smooth out bumps, give them a trusted source of feedback, and/or a sounding board & paves the way for networking opportunities”. Well, every point is so true. Adam provided such valuable feedback on my Vizzes and small design tips that made a big impact. Adam stood with me like a great friend during the toughest phase of my life this year and helped me heal and get back on track. He is genuinely one of the most inspiring and motivating member of the community. It was because of his guidance and confidence in my abilities that I became a Featured Author recently. I was so happy that Adam recently won The Michael W. Cristiani Community Leadership Award during TC20 for everything that he does for the community and is undoubtedly one of the most inspiring community leaders. I learnt from Adam how important it is to give back to the community and what a great feeling it is to see others grow. I am so blessed to have a mentor and great friend like Adam.
Growing and learning with the community helped me discover my passion for data visualization and bring out my creative side. This amazing community has given me the opportunity and the platform to improve my skills, meet lifelong friends, and help me grow in my career. Thank you everyone for your support. You all are the best!
Pradeep Kumar G (United Arab Emirates)

Twitter | LinkedIn | Blog or Website
The Tableau Community is such a great place filled with amazing & kind people, and I learnt a lot from #datafam this year :) Due to the coronavirus pandemic, I was stuck in Dubai several hundred miles away from my hometown in India. Thanks to Tableau because I got more leisure time to engage and explore various data viz techniques. (Also, I had no chance to go out due to lockdown.)
I wish to mention two people who recently inspired me a lot in terms of design skills. The first one is Judit Bekker (@juditbekker) who has some amazing and cleverly designed vizzes. She also won the Best Designer Vizzie for this year. Another one is Nadieh Bremer (@NadiehBremer). I was really mesmerized and awe-struck by looking at her portfolio. I would strongly recommend people to take a look at her website to get some awesome design inspirations.
Also, I am really honored to become a Featured Author, Tableau Public Ambassador, and Top 5 authors with the most favorited vizzes for this year. I wanna take this chance to say thanks a million to all such wonderful people who supported and helped me to reach all this way! Thanks to all those peeps who inspired me and those who took me as an inspiration.
Finally, I wish to thank my friend, Kevin Flerlage (@FlerlageKev) who always supported and guided me from the beginning of my Tableau journey. He is more than just a good human being and I could not thank him enough for everything he has been doing for us (datafam).
Prasann Prem (India)

Twitter | LinkedIn | Blog or Website
Editor’s Note: Prasann covered his response in his 1st blog post below:
Pratik Chaudhary (United States)

Twitter | LinkedIn | Blog or Website
Awesome People.
Do I need to pick one, two, three, four people? Or should I mention the entire #DataFam for inspiration? I’m sure many of us working with Tableau may have thought of it at least once, twice; sorry, I don’t want to start it again. Being a self-taught individual with no formal training, many people have played a vital role in my growth and learning; and I’m very thankful to them.
We often express our love for #DataFam as a whole. So, I choose individuals this time. I still remember the day I sent a request to Zen Master Chris Love (@ChrisLuv) on LinkedIn. I was so confident that he will decline. He was a master of his craft, and I was a novice and why someone wants to spend their precious time on some random newbie. But man, I was so wrong and still feel very happy about it. I have never looked back since and reached out to many fantastic individuals to support my learning, and never disappointed. That’s the reason I did the #30days30people challenge on my Twitter (see above for link) to express my love for all such people.
Simon Beaumont (@SimonBeaumont04) is another such person whom I have known for three years now. He is always there whenever I need his advice. Ken Flerlage (@flerlagekr), Lindsay Betzendahl (@ZenDollData), Zach Bowders (@ZachBowders), and Kevin Flerlage (@FlerlageKev) are not different. I feel assured whenever I reach out to them for any of their help. The funny thing is I bonded with all of them over social media. So, you can imagine (visualize 😂) why we call it #DataFam and nothing else.
I won’t add any more words as I’m not good at expressing my feelings. But loads of virtual hugs and much love y’all. Thank you, Adam, for giving me this opportunity and all things you do for #DataFam. #30days30people challenge is also coming back so please join in to express your gratitude towards awesome people.
Priya Padham (England)

Twitter | LinkedIn | Blog or Website
Ever since joining the community early this year, I have met so many amazing people. I remember being so nervous to post my first #MakeoverMonday viz on Twitter but, as I began to post more and get involved, I realised that there wasn’t anything to be afraid of. Everyone is so encouraging and supportive, and they want to help you to improve and see you succeed.
There are so many people who have inspired me, so I definitely wanted to include some shout outs (I’m so sorry if I’ve missed anyone out!): Adam Mico, Dzifa Amexo, Ghafar Shah, CJ Mayes, Ken Flerlage, Kevin Flerlage, Thi Ho, Francisco Cardoso, Ravi Kumar N, Gary Collins, Eric Balash, David Borczuk, Vince Baumel, Katie Wagner, JR Copreros, Jonni Walker, Lorna Brown, Michelle Frayman, Hesham Eissa, Toan Hoang, Pat Sarsfield, Sedale McCall, Tamas Varga, Takafumi Shukuya, Sekou Tyler, Priyanka Dobhal, Pawan Sachdeva, Abisola Oni, Eva Murray, Luigi Cicciari, Marc Reid, Cesar Picco, John Whitmer, Sam Parsons, Alexander Varmalov, Christian Felix, Zainab Ayodimeji.
Being part of this community has changed my life completely, and I can’t thank you all enough!
Priyanka Dobhal (India)

Twitter | LinkedIn | Blog or Website
2020 has been such a crazy year, and yet so much good came out of it for me :)
When I look back at 2018, the year I was introduced to Tableau, I never thought someday I would be in such a good place. The Data community is so encouraging and friendly that I just blended in easily (even though I am not so easy to open up). I’m amazed by how people in the community take time to run initiatives like MakeOverMonday, WorkoutWednessday, IronQuest, SportsVizSunday, Project HealthViz, etc. It shows that people understand the value of giving back.
I have never been a fan of social media so back when I joined Twitter (just for Tableau), I didn’t expect myself to stick around. But now, Twitter is my way of staying connected with all the folks who have started to become part of my data family.
What inspires me the most is the new folks like Priya, Zainab, Pawan, Luther, and many more who have just grown so much in a year. It pushes me to learn from their style, process, and will to work.
Did I answer the question? I hope I did because I went back and forth on this so many times. Haha!
To end with, You guys are amazing! Thank you all for your constant encouragement and support.
Priyanka Rohatgi (India)

Rajeev Pandey has been a constant source of inspiration for me from the very beginning. Right from the point, I decided to start with datafam and my journey thereof, I have been constantly motivated by him to put out great work. I see a huge difference in my design aesthetics, dashboarding techniques for the better and I am glad that he was a part of my journey and that I got to learn so much from him.
Purva Sawant (United States)

Twitter | LinkedIn | Blog or Website
I have been practicing and working towards improving my Tableau skills. With the lockdown, I got more time to focus on it. However, I realized that if I had some kind of guidance that would make a tremendous difference to my journey. I signed-up for Adam Mico’s Mentoring meet-up program — and this is where I got paired with Ella Worsdale.
I explained to Ella what exactly I was looking for with my Tableau skills. Knowing my requirements she guided me in improving my visualization skills and ways to network in the community and to build my profile. Having her as a mentor not only encouraged me but also I knew that I had somebody with whom I could discuss my concerns and not stress about them. This has been one of the best things to have happened professionally this year and I really appreciate all the work that Ella puts in towards my progress.
Rajeev Ranjan Pandey (India)

Twitter | LinkedIn | Blog or Website
I find inspiration in a variety of people and things. I would have to say that the person who has most greatly inspired me has been Pooja Gandhi. Her passion for tableau was motivating and put the fire in me to climb the ladder in my Data Visualization career. There is no second thought that Pooja is well respected and always gave more than she received especially during the initial years. She was a leader in the Tableau community and helped so many folks by answering their questions in the community channels. I try to live like her as much as I can and trying my best to contribute the same way.
Rajavel Selvaraj Ganesan (United States)

Twitter | LinkedIn | Blog or Website
Datafam = AWESOME
#Datafam community is awesome. When I started learning Tableau deeper this year 2020, I started following a couple of hashtags to get some learnings within the tool. I should highlight that, all of the #datafam is awesome and being super supportive throughout this journey.
They share inspiring Viz to get a lot of learning out of it and also help/assist any folks who are interested to achieve similar which makes the #datafam so special. Some of the authors I inspire from it are Praveen Punnen Jose, Naresh, Pradeep Kumar G, Priya Padham, Judit Bekker, Ghafar Shah, Priyanka Dobhal, CJ Mayes, Autumn Battani, & many more in the #datafam community.
Inspirations
Praveen Punnen Jose made me know more about Adobe XD. Tamas Varga inspired me to learn more about Figma. Naresh always inspires with his awesome Sports Viz & Other Viz — (i.e. How to portray or story tell the data we see for others to easily understand). Judit Bekker inspires with her unique style (Small Data — Play BIG :) ), Priya Padham has a unique style and her choice of colors always makes to think and understand how to build such viz. Ghafar shows his continuous contribution to Make Over Monday’s & how it has shaped or transformed his Viz from earlier to now is simply awesome.
IronViz Experience
#IronViz journey was totally phenomenal. I learned a lot of great things during that 1 Month of Viz design. I went with simple charts but wanted the storytelling to be nice and clear in the form of long-form for web users and mobile sized design for mobile/tablet viewers. I discussed with a lot of great folks to get suggestions or feedback. A.D. Mac was super helpful in sharing some amazing Map Tips. Chris provided me with some great tips. You can check out my Iron Viz Experience over here & learn as well (link).
Mentor-Mentee Program
Adam Mico, Vinodh Kumar V R & a few others started this Datafam mentor-mentee program. If you’re new to Tableau and looking for a mentor — this is a great platform to reach out for a mentor and grow yourself. My mentor is Mike Summons — he is super helpful with reaching and making sure I’m comfortable with tableau and needs any help or not. We have a monthly connection to discuss and grow each other working with Tableau. Thanks to the whole team for arranging this program for folks to learn and grow up the ladder.
Zen Masters = POWER of Knowledge
I shouldn’t stop with this — the great Zen Masters knowledge sharing is super helpful for newcomers like me to learn/understand deeper. Flerlage Twins, Sarah, Lindsay & many others — can’t stop with few names. Everyone is truly a Zen Master & Inspires other #datafam with positivity and knowledge sharing.
CrackerzIn
I do own a blog or site which primarily focuses more on the Business Intelligence space. I talk a lot about MicroStrategy & then Tableau, Power BI & little Qlik as well. I inspire others with the knowledge that I have got to be shared with others & would love to see the folks getting inspired from it. Hope you enjoy reading my blog (see link under my pic)!
Overall, I am very happy with my journey with Tableau and excited for the future with this tool.
Ravi Kumar N (India)
Twitter | LinkedIn | Blog or Website
Thank you everyone in the community for regularly adding helpful content. Special thanks to my mentor Mahfooj Khan for his regular feedback on my vizzes and it has helped me improve my viz skills. I am glad to have met him through the community.
I try to participate in MakeoverMonday challenges and it has helped me a ton to improve my storytelling, design, and analysis skills. Thank you, Andy, Eva, and Charlie for this wonderful initiative.
It was great to virtually meet so many of the community members at the Tableau Conference. I personally feel there is something to learn from everyone in the community and I look forward to it.
#datafam, thank you for all the support and collectively y’all are the best:)
Cheers!
Ravi
Regis O’Connor (United States)

There are so many in the #datafam that inspire me — where do I start? Bridget Cogley with her urging to be kind during the pandemic, Lindsey Betzendahl’s transparency, Sarah Bartlett’s diligence, Lorna Brown’s sheer joy, and Adam Mico’s encouragement to this shy introvert. Thank you all so much.
Riddhi Thakkar (United States)

From the time I have joined the Tableau Community my life has changed. There are so many amazing authors out there who inspire you by their vizzes. Some have great analysis skills, some have creative designing skills and some amaze you by their storytelling and vizzing techniques. And I have always felt that this has allowed me to explore and learn every day.
My Tableau journey started by following Andy Kriebel and Eva Murray. To date I try to follow the techniques and best practices they share. Anytime I have reached out to Lindsay Betzendahl and Sarah Bartlett for feedback they have always been kind enough to spare time and share their thoughts. When I am trying to do something new, my first place to look for a solution is Kevin Flerlage and Ken Flerlage’s website, and to be honest they never disappoint me. I have learnt so much from Adam Mico, to help each other and never hesitate to make new friends. I am always awestruck by the work that Chantilly Jaggernauth shares. It looks so simple but every object that is on her viz has a reason why is it there. I also look up to work shared by Swati Dave, Vinodh Kumar, Michelle Frayman, Ghafar Shah to name a few. Everyone in the #datafam has their unique way to present the data and that is just wonderful.
Sagar Kapoor (India)

Twitter | LinkedIn | Blog or Website
Thanks to Divya Bharathi, Adam Mico, Aloysius Ong, and Vinodh Kumar V R for all the help, support, and commitment for VizConnect which has helped everyone in the community to get inspired, connected, and motivated. They have also helped in many other initiatives to help people improve Tableau and Data Visualization and Storytelling skills.
I am also inspired by the many presenters spending time preparing and sharing knowledge with our global community. We have been very fortunate to have weekly presentations from some of the best talents in dataviz and seeing our VizConnect family use that information to better themselves and pay it forward is so exciting to witness. It inspires me to always attempt to do even more to help our community.
Sam Batchelor (Australia)

Twitter | LinkedIn | Blog or Website
Fred Fery has inspired me with his passion for Tableau! He makes room for Tableau in his day by getting up at 5 am to work on his vizzes. He’s a board member for Viz for Social Good and has made VOTD 3x already. Fred has done Tableau intro sessions and workshops for Brisbane universities and presented at the Tableau user group. He’s a very friendly and supportive member of the #datafam and makes an effort to attend community events and be ‘part of the conversation’. It’s a joy to be in the same city as Fred and I’ve so enjoyed watching his skills grow and grow. Historically, Fred hasn’t even worked with Tableau in his job, so to be at such a good level through his sheer enjoyment and persistence is fantastic. Thanks for being such a great member of the Tableau community @fredffery!
Samuel Parsons (England)

Twitter | LinkedIn | Blog or Website
This is such a great topic and I would like to join the community celebration of 2020, by focusing on those new to the community this year.
Early in 2020, we saw an influx of new names and faces that really helped bring a breath of fresh air to our Tableau community. These people have not only inspired me but the vast majority of the community and even each other.
I will no doubt not be able to name everyone here that is new to our community.
To begin with two individuals that know each other very well and I have felt have particularly pushed everyone on a step when considering their our own vizzes. Of course, that is Tamas Varga and Judit Bekker. These two have demonstrated a strong style that others have obviously been influenced by and they have shown us that using Gradients in viz design is not necessarily to be avoided and if used well can really help enhance our vizzes.
A lot of the new community cohort have been recognised via the Tableau Featured Author programme — individuals such as JR Copreros, Steven Shoemaker, Francisco Cardoso, Eve Thomas, Takafumi Shukuya, Ghafar Shah, Autumn Battani, Anjushree BV, Luther Flagstad, Tausif Kazi, and of course Priya Padham (feel free to edit your name to the start of the list! Ha).
No doubt I have missed some key names — apologies to those people.
Essentially though, this cohort of individuals have breathed vibrancy into this community — seemingly always to be producing vizzes weekly (daily in Eve’s case!) of such high quality. They all push the rest of us to take notice and raise our game and for that they should be commended. Not at least to say how receptive to feedback they have been and willing to share their work and help others improve.
Lastly, there are two individuals that I would like to call out who are not new to the community, but both have inspired me in similar ways. These two constantly “wow” me whenever they publish something new and I really do wish they become more recognised for their efforts.
With so many conversations happening over Direct Messages, I just want to say I rarely, if ever, speak to these two — so there is no invested interest here.
The first is Alexander Varlamov. His work is just the stuff of dreams for me, always inspiring and completely humble when publishing his stuff. I had the pleasure of meeting Alex last year at the Tableau conference in Berlin and he came up to me asking for a photo of me (which I found completely bizarre, seeing I am more his fan than the other way round!). Knowing that Alex is not allowed to compete in #IronViz because he is from Russia, it gave me such a big smile that he was made Tableau Ambassador this year! My wish for 2021 is that Tableau go the next step and recognise his brilliance as Zen.
The last person I want to call out is someone I have no doubt will be mentioned many a time in other people’s own thoughts. That is Robert Janezic. Recognition is surely just a matter of time for Robert! His work this year has been of the highest class. Ebb and Flow were just mind-blowing, the ability to produce a chart like that and then present it in such a classy way was fantastic. In a similar vein, Robert’s IronViz entry was hugely impressive, making such great use of Tableau’s great interactivity. My one ask of Robert would be that he does more presentations of his work! We want to learn from you, Robert!!
Putting world events to one side, 2020 has been such a fulfilling year for our community and thank you all for inspiring me so much.
Sam
Sarah Bartlett (England)

Twitter | LinkedIn | Blog or Website
When COVID-19 hit in March 2020, everything we know suddenly came to halt. With the majority of people being told to stay at home, our opportunities to interact with the Tableau Community we suddenly very limited. At the time, few TUG’s were running virtual events and all in-person TUG’s or events were canceled. I was chatting with Kevin Flerlage at the time and we agreed that it would be great if there was something we could do to help bring people together virtually and give the Tableau Community something to look forward to. We discussed the idea with a few other friends in the #datafam and eventually, the #DatafamCommunityJam event series was born! Kevin, Emily Kund, Lorna Brown, Alex Walczek, Jordan Scott, and I worked together to organise and facilitate 11 virtual events throughout the lockdown period, right through to TCish in October. The events were a collaboration between The Tableau Fringe Festival and Tableau; meaning we were able to leverage the platforms and expertise of both teams. The events not only gave us something to focus on during this uncertain time, but they also helped bring the global community together. We held events aligned to all different time zones to ensure everyone could join an event and we brought together speakers from multiple regions and backgrounds.
I’m incredibly grateful for everyone who was involved in these events. The organising team were amazing and enjoyed working alongside you all. It was so much fun working with you all and it was a welcome distraction to everything that was going on in the world. We wouldn’t have had any events without speakers and I’m thankful to every person who applied to speak at the DFCJ. I appreciate some of our speakers had never spoken at a Tableau event people so it was exciting to see some people deliver their first-ever talk. I learnt so much during these events and I’m thankful for everyone who shared their knowledge with us. Finally, I’m grateful for Jordan Scott and the Tableau team for supporting and marketing this event series and letting us be creative with our event ideas. It wasn’t uncommon to have more than 10,000 people registered for each event! We never anticipated they would be this popular! For me, one of the highlights was the live results reveal we ran for #IronViz! This had never been attempted before and I hope you’ll agree it was a lot more exciting than a blog post.
While 2020 has been a challenging year for most of us, it was events like these plus all of the virtual TUG’s and events that helped to keep the Tableau Community spirit alive. I’m truly impressed with how quickly everyone has adapted to the virtual event format and I’m grateful for everyone who has continued to run virtual events throughout this year or found other innovative ways of bringing everyone together virtually. Thank you, #datafam!
Scott Briggs (United States)

This is my 1st participation in a community blog. In 2020, I would love to thank:
- Kevin Flerlage for helping me prepare to present at the first #datafamcommunityjam (which included a 1-hour Zoom call among other things).
- Mark Edwards, Kate Brown, and Katharine Rosacker for showing what it means to show continued support following a braindate at TC.
- Zach Bowders for reaching out to me (despite never communicating with me before) to show appreciation for a comment I had to someone and had been passed on to him. He had no idea, but I needed it that day!
- Bridget Cogley for a one on one braindate that has continued to inspire me for 4 weeks now.
- Ryan Nilsen for being a fantastic boss (he won’t read this so I’m not just sucking up, but he really is great to work with).
And…..the datafam as a whole. My little girl turned 7 on March 19th, roughly a week after COVID hit the fan here in the USA. Weeks of planning for her party went down the drain and while brave and showing a good face, we had a heartbroken girl on our hands. Not knowing what to do, I reached out to you all, the datafam, for well-wishes to my girl and to include where you were from. Wishes came in left and right from EVERYWHERE!. We had so much fun as a family looking up where you were all from, where each wish came from, and learning more about your cultures. It was such a meaningful experience for us as a family, I’d daresay even more meaningful than another party would have been. You all came though for us — that’s what a FAMILY does! I sincerely thank you for this. It’s fantastic being part of the best user group of any platform known to man!
Sean Miller (United States)

Twitter | LinkedIn | Blog or Website
There are so many people in the community who continue to inspire me. I’m afraid to start naming names because I will certainly forget someone — but I will do my best and add a friendly disclaimer that not being mentioned here DOES NOT mean I’m not inspired. Also, the order in which I mention these are completely random. :)
Sam Epley (@epleysamuel) — Need to keep an eye on him (and follow him of course). About, halfway through the year he found and started working through #WOW2020 challenges. Not only did he manage to reach 100% completion but he also takes the challenges to the next level by adding his own enhancements! Really cool stuff.
Autumn Battani (@aabattani) — What a lovely ray of sunshine Autumn is! Not only are her design skills top-notch, among the best but she also brings her own brand of humor, compassion, personality, and community. It’s so awesome to see.
Simon Beaumont (@SimonBeaumont04) — Simon is a community leader in so many ways but recently, the work that he’s been doing to bring to light the internal community work that he’s been fostering at JLL. For anyone who’s running or looking to start a Center of Excellence should be following Simon.
As I stated at the onset, the community is amazing and I’m continuously inspired by what they create and the conversations they have.
#GoForthAndViz
Sedale McCall (United States)

Twitter | LinkedIn | Blog or Website
Adam Mico has been a tremendous inspiration both as a creator, a mentor for viz creation, and as a member of the #datafam. I entered the community around April of 2020 and we met in June when I was writing a guest post on his blog related to certifications. Since then Adam has always been available and ready to not only help me with a challenge but also find opportunities to get involved (in fact I’m writing this from a DM Adam sent me about this opportunity!)
But while being a great mentor to people like me, Priya Padham, and many others, he is also charting his own path in the community and being an example of what we all hope to contribute. I appreciate the time he has given to me and the time he gives constantly to this awesome community, he’s one of the people that make it as great as it is!
Sekou Tyler (United States)

Twitter | LinkedIn | Blog or Website
Whats up #datafam!
2020 has by far been the most active that I have been in the community. I have virtually met so many great people and I’m looking forward to actually meeting people in person (whenever that happens). The #DataFam constantly inspires me and it isn’t always because of the different #datavizzes that people post. Personally, I have received so much support from people that I have not met in person and it’s truly one of the best things that I have experienced. This community has so many supportive, smart, funny, and caring people. 2020 has been a year, but being able to be actively involved in the #datafam community has been one of the biggest highlights for me.
There are so many people that I want to name and I know I’m going to forget some people so please forgive me in advance. I want to give a HUGE shoutout to Chantilly Jaggernauth, Jasent Walker, Candra McCrae, Sedale McCall, Teneika Askew, Renee MacLeod, Adam Mico, Abisola Oni, Amanda Boyle, Spencer Baucke, Allen Hillery, Priya Padham, Joshua Smith, Sam Parsons, Sarah Barlett, Dzia Amexo, Ghafar Shah, Zach Bowers, Lindsay Betzendahl, Mark Bradbourne, Brian Moore, Jacqui Moore, Jeff Plattner, Jim Dehner, Emily Kund, Ken Flerlage, Kevin Flerlage, Judit Bekker, Seffana Mohamed, Michelle Frayman, Tamas Varga, Thi Ho, Vinodh Kumar, Eric Balash, Andrew Grinaker, and Jordan Scott,
I only knew a handful of people from this list at the beginning of the year so it’s a bit surreal to be able to name so many people that have made an impact on me in the #datafam community. I’ll forever be grateful that our paths were able to cross, and I’m excited to keep growing with each one of you! Keep doing amazing stuff in the world #datafam!
Selvi Alagesan (United States)

Twitter | LinkedIn | Blog or Website
Vinodh Kumar VR work in the community inspired me this year. When I entered the community, Vinodh was the first one to welcome me, explained to me about the ongoing community projects, helped me understand how participation will help me improve my tableau skill set. The mentorship initiative helped me get genuine feedback for my Visualizations. I’m sure it is helping a lot of people out there. Thank you Vinodh!
Sergiu Rotaru (Romania)

Twitter | LinkedIn | Blog or Website
I want to thank Andy Kriebel, Eva Murray, Charlie Hutcheson (from #MakeoverMonday), and Sarah Bartlett (from #IronQuest) for their dedication and passion to help others to grow. I learned a lot in terms of data visualization and leadership from this 2 data communities. Participating weekly in #MakeoverMonday and following #IronQuest I felt motivated to take the lead to make an impact in Romania, on a national level.
Following these 4 data community leaders, I discovered in 2020 my dream for the next 10 years: To influence/help 1,000 people to become better at analyzing and visualizing data. A first step in fulfilling this dream was the initiation, together with Madalina Andrei, of #RomanianDATA — a data visualization community on LinkedIn. If you are interested in improving your analytical skills or finding out more about our country by exploring insightful charts, you can participate with monthly submissions or follow our community (follow the #RomanianDATA hashtag on LinkedIn)
In conclusion, these 4 people inspired me to help other people from Romania to increase their analytical skills and to improve the quality of data visualizations in Romania. Thank you very much for this!
Shivam Mittal (India)

Twitter | LinkedIn | Blog or Website
Hi everyone,
My name is Shivam Mittal and I am from the capital of India, New Delhi. I was introduced to Tableau back in 2019, but until March 2020 I was using Tableau only for work and only making business dashboards and was unaware of Tableau Public and super supportive and cool datafam community.
Fast forward March 2020, when I started participating in MakeOverMonday -a weekly social project to improve upon visualizations, I got to know the #datafam community on Twitter and boom, I was surprised to see beautiful visualizations, supportive community members, inspiring vizzes all around.
There was no looking back after then. Each datafam community person is ready to help which I loved the most and it made me realize that giving back to the community is so important.
I will like to call upon a person who inspired me very much, he is none other than Adam Mico himself. Man! Adam is a person whom I can go and ask for feedback for vizzes. It was super easy to have a conversation with him every time. The feedback helped me improve a lot, the simple tips and tricks were amazing. Sometimes, he even just worked on my viz directly and then DM me that we can do this like this and that. Just WOW!
He is always there sharing the work of people, retweeting them, and inspiring everyone. I never hesitated before asking him for feedback, because it was super easy to have initiated a discussion with him. Also, he makes sure that if he finds something that can be improved he always took out time and let me know that we can do this or I can try out this Everything means a lot to me as it helped me get good and learn things and then also implement those things at my workplace as well.
Thank you for everything you do Adam. Keep inspiring us!
Srishty Choudhary (India)

Twitter | LinkedIn | Blog or Website
Hi there, I started to take part in the community in April this year. I was doing Makeover Monday, SDG vizzes, and some personal projects as well. During my initial month when I started to take part and started to have conversations with other folks in the community, I found Vinodh and I asked him to guide me. Due to time constraint, he suggested me to check mentor-mentee program. I got excited and then I had asked Rajeev Pandey to guide me. Rajeev is such a talented person and at the same time, he is very kind. When a few months back, COVID had hit my family very badly he was still there with me. He called me and he enquired about me. That made me feel better. Though I have lost track and nowadays I am not able to participate in makeover Monday. Still once in a week, I get his message asking if everything is fine at my end or not. I will always remember this gesture of Rajeev in all possible ways. Because sometimes what matters is — someone asking you “Are you all right. Let me know if you need something”. And I will be grateful to Vinodh for introducing me to Rajeev. I hope to make a comeback soon and interact with all awesome community members. Cheers!
Simon Beaumont (England)
For me personally, 2020 has been a year when I have needed smiles and laughter more than ever before; an escape from the harsh realities of the global pandemic and the isolation felt when not being able to see, in person, friends from the Tableau Community.
I would like to recognise Laura Sandford and Adam Green for their Alphabet Project initiative where they treated us to visualisations that worked their way through the alphabet, from A to Z.
The initiative has given me a release, it has given me smiles, but it has also given me hope by resonating with why I started personal vizzing 5 years ago, the fact personal vizzing can be fun, it can be a creative outlet and it doesn’t have to be serious all the time!
The commitment that Laura and Adam have shown to keep the initiative going through lockdown should be commended and I believe we all owe them a massive thank you for their efforts. Releasing new content every 2 weeks is tough; settling on a topic, finding the data sets, developing the vizzes, it all takes time, and time is often something we all struggle to find. Yet Laura and Adam never missed a beat, they have kept sharing creative, fun, quirky (and I mean that as a massive compliment) visualisations, some of which have received deserved Viz Of The Day recognition by Tableau Public. Personally, I am not sure I will ever forget Adam’s animated galloping horses or Laura’s ‘Teletext’ style Sanboozle!
Our community is stronger for community initiatives and Laura and Adam have taken an innovative and fresh take on this. I would like to give a genuine and heartfelt thank you to them both for making 2020 a little easier to bear and also for, no doubt, inspiring many people to share their personal creations on Tableau Public, creations that we all benefit from when it comes to inspiration and learning.
Siroros Roongdonsai (Thailand)

I think Vinodh Kumar is the person who inspired me the most in 2020. Personally, I love his SDG Viz Project (with Brian and Jacqui Moore); it is an excellent example of doing good through data, opens communication, and helps people better understand international issues, and raises awareness for them. This is so useful for the community.
Spencer Baucke (United States)

Twitter | LinkedIn | Blog or Website
This year I have sincerely enjoyed seeing this news wave of Tableau Public authors take the Tableau scene by storm. Shoutout to Steven Shoemaker, JR Copreros, and CJ Mayes among others that have taken the lead and pushed the community forward.
Stephen Lindsay (England)

An inspiration for me over the last year has been Simon Beaumont. Much of what goes on at JLL seems pretty inspiring to be honest. I reckon they’re secretly lining themselves up as a Tableau Consultancy to compete with The Information Lab. Simon has been especially inspiring for me, hearing him talk with passion about the data culture they’ve set up at JLL, seeing the quality of the design guidance and overall support they have in place, whilst still enabling development at pace where required. Also, the authenticity that Simon talks with really comes through. If all of that was not enough, to get to the IronViz final was awesome. Well done.
Editor’s Note: Please check the bottom for Stephen’s fantastic viz for this blog post. Thank you, Stephen!
Surabhi Srivastava (India)

Twitter | LinkedIn | Blog or Website
Happy to be contributing here as a newbie dataviz enthusiast! As a researcher in biology, I was used to simple tables and graphs created in excel, that did not really communicate anything to anyone other than a tiny niche audience. It’s only in the last couple of years that I started exploring the world of data analysis and data presentation in its own right. And this fledgling interest seems set to bear fruits beyond my expectations.
Starting out, there were many platforms to explore — till I realized the magic and ease of making a #Tableau viz, without knowing too much coding. That was a few months ago, and I haven’t looked back since. I am thrilled to have just completed my first Tableau course from Udemy “Tableau 2020 A-Z: Hands-On Tableau Training For Data Science“, a very well structured and hands-on experience by Kirill Eremenko (@kirill_eremenko), that taught me how to create my first dashboards and so much more.
Along the way, I joined Twitter to follow data visualization trends and found a friendly and helpful community as an unanticipated bonus :) It began with #MakeoverMonday, of course — the patient, thoughtful analysis of vizzes provided every week is unbelievable, and a great early learning experience. I connected with some amazing #datafam folks through the #VizConnect initiative — timed for Friday evenings, it’s the perfect inspiration to get down to some weekend vizzing. As I learn more, I have started following projects on biological and health data, thanks to initiatives like #ProjectHealthViz and #vizforsocialgood. My first #MakeoverMonday #Viz5 challenge was when I learnt about the work by https://opfistula.org/ on making a difference and working towards gender equality in healthcare.
My experience with Tableau and engaging with the community has taken me back to my graduate school days, with all the heady excitement of tackling a new problem and solving it — and having mentors and peers for advice and inspiration. Focusing on data visualization really helped me maintain some measure of sanity and positivity amidst the countrywide lockdowns and the pandemic panic that’s defined the year 2020. I was able to get some great inputs and confidence to attempt visualizing SARS-CoV-2 sequencing data that my institute is involved in (https://www.dataviz.in/sars-co-v-2-genomic-variants-in-india); something that began as a new interest has started integrating into my work life as well! It’s been very rewarding, and I hope to continue learning and hopefully give back to this amazing community someday.
Swagat Kumar Jena (Singapore)

Twitter | LinkedIn | Blog or Website
Toan Hoang is the person I am so thankful to for most of the visualization I have made this year. Every time I am stuck with the thought of which graph should I create, his website is the go-to place for me. The visualization he creates and the way he creates them is amazing. I have even tried implementing a few of the bespoke visualization at my workplace as well. I also had an opportunity to meet him during TC20 virtual braindate and to be honest, it was rejuvenating. I learnt a lot from him during that date 😊. His advice on how to shape up the future, what things I must do to which books I should read. He is the best guide one can have. He is a teacher for me in every aspect. Thanks a lot, Toan Hoang (Tableau Magician).
Swati Dave (Singapore)

Twitter | LinkedIn | Blog or Website
2020 has been tough for everybody. Confined in our home and working brought its own challenges. I would say all the wonderful and inspiring women in #MomsWhoViz has kept my spirits high. There is strength in knowing you are not alone and have people who can understand and cope with similar challenges as you do. I am immensely proud to be part of it. They inspire me with their talent, support me with their compassion, and encourage me.
Another person from the community who has been my constant source of support and belonging is Iram Javed. I came to know of her through the community and I am lucky to have her as my friend and confidant. We talk about everything from vizzes to work to food to yoga 🧘♀️ 😊
Tamas Varga (Hungary)

Twitter | LinkedIn | Blog or Website
It’s really hard to pick one author or story. When I’m looking for outside-of-the-box ideas I usually turn to Toan Hoang’s Tableau Magic as there are pretty detailed tutorials to learn from. Alex Varlamov’s Cool Blue Data is just visually and technically stunning but I wouldn’t dare to try his ideas (He’s a wizard!). There are so many fantastic authors out there sharing their ideas, I could write the list all day long.
And — of course — there’s Judit Bekker. I’m happy to have her as a friend but as an inspiration as well as she has a totally different point of view on how to approach visual concepts and ideas and she’s always nailing it.
If there’s one story to mention this year is that recently Marc Reid contacted me to do a guest blog post on his site, datavis.blog on a viz that I created. It was a huge surprise, a great honour, and a major challenge to overcome, as I never before had to think through and document my process of building vizzes. So I can’t be thankful enough to Marc for pushing me outside of my comfort zone.
Tanvee (India)

My friend Pawan Sachdeva gave constant support for developing and polishing tableau skills. I made the worst dashboard but he still gave me honest feedback and helped to improve my skills. My tableau journey started by chance but my mentor Regis O Connor and Pawan Sachdeva made it amazing and worth enjoying. A big thank you to data fam. I still new but trying to raise my learning curve.
Tarun Deep Chhabra (India)

Twitter | LinkedIn | Blog or Website
The entire datafam community is my inspiration for 2020. It is one of the best and is doing all required to engage everyone no matter what their skill set. This community is also so welcoming to all newcomers which is so unique and wonderful. I enjoy being part of it.
Tausif Kazi (India)

Twitter | LinkedIn | Blog or Website
It is very difficult to name a single person in the #datafam. There are a lot of people who are participating in the projects and everyone gets motivated by looking at each other’s work. The same thing I do and try something different and that interests me.
Thi Ho (Singapore)

2020 has been a very special year for me. It’s the year that I stepped out of my own little world and into the amazing, always buzzing, and very supportive #datafam! I am thankful to so many people who have been there in my journey, who have been kind and encouraging in many ways. I’d like to thank our Singapore TUG leaders, Sarah Burnett and David Murphy, who hosted engaging TUG sessions that originally brought me closer to the Tableau community! I’d also like to thank Meera Umasankar whose work has inspired me since my early days and who told me that the #datafam is on Twitter, which was the reason I reactivated my long-dead Twitter account.
I appreciate my awesome mentor and friend, Kevin Flerlage, who has been really kind and encouraging. I can never thank him enough for his feedback, advice and encouragement. He was also the first person who nominated me as #TableauFF when I still didn’t know what #TableauFF was. My heartfelt thanks also go to two other very kind people, Adam Mico and James Goodall, who are key pillars of the community and who also nominated me. I appreciate all my amazing #datafam friends all over the world, some of whom I have had the chance to chat or interact with via Twitter or during the TC20, like Priya Padham, Dzifa Amexco, Wendy Shija, Jyoti, Annabelle Rincon, Kimly Scott, Swati Dave, John Whitmer, Ghafar Shah, Marc Reid, Adam Mico, Vinodh Kumar, CJ Mayes, James Goodall, Iram Javed, Satoshi Ganeko, Frederic Fery, Giovanni Lucky, Ravi Kumar, Fred Najjar, Pawan Sachdeva, Mala Deep Upadhaya, Duy, and many others.
Priya Padham is my newly found sister. Besides being so talented, she has been really sweet, kind, and supportive! Priya has introduced to me some really nice songs and I shared with her my outdated favourite band which surprisingly, she knows! We have some common interests such as English big breakfast and I would like to bring her Vietnamese food, it’s unbelievable that she has not tried any! We have exchanged so many virtual penguin hugs! I hope one day we can give each other a real hug! I’m really happy to see her amazing achievements this year!
I am usually hesitant to reach out for help as I am afraid to bother others as I know everyone is busy. However, I received immediate “yes” answers when I reached out to these amazing people for their feedback during my first #IronViz submission despite their busy schedule. That was Priya Padham, Judit Bekker, Lindsay Betzendahl, Adam Mico, Brian Moore, and Zach Bowders. That meant a lot to me! Thank you so much! I appreciate leaders of community projects like Eva Murray, Charlie Hutcheson, Andy Kriebel, Sarah Bartlett, Lindsay Betzendahl, Vinodh Kumar, Brian Moore, Jacqui Moore, and all leaders of #VizForSocialGood, especially Chloe Tseng, Vanitha Lucas, Frederic Fery, Neil Richard, Keith Dykstra, and my Singapore co-leader Hui who have been giving up their personal time to help the #datafam members to improve their data skills and contribute to meaningful social projects.
I appreciate people who have selflessly shared knowledge in dataviz through blogs and videos such as Toan Hoang, the Flerlage Twins, Andy Kriebel, Jeffrey Shaffer, Marc Reid, Sarah Bartlett, Lindsay Betzendalh, Eva Murray, Luke Stanke, and many others. There are so many amazing people whose work has been really inspiring and they are truly kind and supportive. I’ve tried to make a list of names but then I became stressed out as I’m certain that I would miss out somebody, so I’d say that is everyone in the #datafam! I’ve found people who use data viz to fight for justice and what they believe in to be truly inspiring and admirable. Most recently, that is Zainab Ayodimeji, who created vizzes to fight against police brutality in Nigeria.
Lastly, I appreciate everyone working at Tableau who has been building the community from the other side. I would like to personally thank Caroline Yam and KJ Kim (as well as my co-presenters Fred, Wendy, and Vinodh) who have made the process of speaking for the Behind the Viz session at TC20 so fun and enjoyable!
Tim Cady (United States)

Twitter | LinkedIn | Blog or Website
In this community there so many that inspire, share, teach… to try to recognize or name all those “givers” would be an exercise in futility. Instead, I’d like to talk a little about my struggle to engage with the community and how the DataFam has helped me come out of my shell a bit.
My first time attending TC in person (NOLA) was an amazing experience but a pretty standard one. I was unaware of the greater community and mostly stuck to co-workers. I left New Orleans excited and energized but there was a small part of me that was looking for more. Over the next year, I found myself getting more involved in my local TUG, combing the forums for ways to help, and eventually discovering the Twitter DataFam through Makeover Monday. Now, fast forward to TC 19 in Vegas. One of the few goals I had going in was to meet more of the DataFam. One of the first people to make me feel welcomed was Katie Wagner. She recognized me at the community happy hour and said hi. Having never met in person, that small gesture went a long way. Over the course of the week I had the chance to meet a few more folks but still mostly kept to myself and felt like I failed at my goal. I’m an introvert by nature, trying to be an extrovert by choice but social anxiety often gets the best of me. Approaching folks to say hi has always been a difficult thing for me. Endlessly over-analyzing situations in my head often lead to awkward first impressions.
With most of us working from home in 2020, it has brought with it the opportunity for us to connect more often albeit virtually. Chatting in small groups (shoutout to the Game Night crew!) and getting to know some of the DataFam rock-stars — whom normally I wouldn’t have the nerve to approach at a TC — has been so rewarding. I feel like these interactions have taught me how to drop my walls for a bit and on a macro level, helped me feel more comfortable in those situations I’d normally feel anxious about.
My point to all of this is this: if you’re reading this and having a similar struggle, don’t disengage. Find and explore an avenue you feel comfortable with. This group of people has so much to give, not just as data viz practitioners but as people.
One quick personal: shout out to Mark Bradbourne! Over the past few months, I’ve gotten to know Mark better through Mentor Meetup. Mark, I appreciate our conversations, your guidance, and your perspective. Nobody embodies the spirit of the DataFam more!
Toan Hoang (England)

Twitter | LinkedIn | Blog or Website
Quite a few people caught my eye and inspired me this year, but two in particular.
Firstly, Zach Bowders has inspired me through his Data + Love Podcast, if you have not checked it out, it is pretty awesome as it gives the opportunity for everyone to listen to the casual conversations around Tableau coffee tables; these casual conversations, like in all expert fields, are the key to growth, learning and thriving as they provide food for thought beyond the technical. While my enthusiasm has generally been downward treading this year, Zach’s Podcast has inspired me, given me a burst of energy, and pretty much made me purchase a Buzzsprout Podcast account (not that anyone will listen, but I will start sharing my thoughts in the new year).
Secondly, Judit Bekker came out of nowhere and her eye for designs has really encouraged me to focus more in this area, so much so, that this has been added to my personal growth and focus area for 2021. As mentioned, I have generally been losing motivation, but this has given me a new lease of life, so hopefully, you will see more coming from me in 2021. Also, it is inspiring and energizing to see someone having such an influence on the Tableau community in such a short period of time.
Vince Baumel (United States)

Twitter | LinkedIn | Blog or Website
This year has brought new challenges to all of us, and it would be irresponsible to gloss over or ignore how difficult it has been for many of us. Through it all, however, I have seen so many examples of our community coming together to support one another, to empathize and commiserate with one another, and to encourage one another to continue moving forward — no matter the difficulty of doing so.
I have loved seeing the industry we all hold dear brought to such a place of prominence — data visualization enjoys the limelight around any election cycle it seems, but with an event like a global pandemic, there is a ton more data being shared and an associated rise in the risk that goes along with inaccurate or misleading data analysis. The remarkable thing about this community though is how focused everyone was on data ethics, transparency, and honesty. Time and time again I saw points being made by data heroes like Bridget Cogley and Fi Gordon about how crucial it is that we be responsible with data. Add to that foundation all of the hard work by Zen Masters Anya A’Hearn, Tamas Foldi, Allan Walker, and Jonathan Drummey with facilitating the COVID-19 data hub on Tableau, and it’s remarkable how much we’ve been able to put data visualization on the map this year.
This year has also included some incredible personal growth from people that I admire greatly — Zach Bowders and his dynamic addition to the podcast landscape with Data+Love, Dinushki De Livera and Jennifer Dawes combining forces to launch Her Data, Lindsay Betzendahl joining with Katherine Rowell and Cambria Brown to publish Visualizing Health and Healthcare Data — a must-have addition to any professional bookshelf, just to name a few! I have been absolutely blown away by the creativity, energy, and passion these people tap into. As always, I feel like I am standing among giants in this community and I am blessed to know every one of them.
One of the events I was most unsure about this year was the Tableau Conference. With so much riding on that week in previous years, I was worried that it would feel lackluster, impersonal, and overly corporate. I needn’t have worried though because of the efforts from folks like Kevin Flerlage, Nelson Davis, Karen Hinson, Adam Mico, Emily Kund, and many others. The community events surrounding the conference (Zoom calls, braindates, morning devotional meetings, dance parties, late night/early morning viz sessions, etc) really made a world of difference and helped fill the void for me.
I am so eager to see what this next year holds. To see how far we’ve come in a year as challenging as this gives me a lot of hope for where that inertia will take us next year.
Vinodh Kumar V R (India)

2020 was an incredible year for me personally when it comes to tableau and community…I became part of 4 community projects and would like to thank all my co-leads for an amazing year (Brian Moore, Jacqui Moore, Adam Mico, Eve Thomas, Mark Bradbourne, Sarah Bartlett, Emily Kund, Sagar Kapoor, Divya Bharathi, Aloysius Ong) and would also like to thank my mentee Selvi for the amazing time discussing all things data viz, coding and society…
Wendy Shijia (China)

Twitter | LinkedIn | Blog or Website
I feel excited every time Judit Bekker shares her viz! I love her simple yet powerful designs and the thoughts and emotions behind them. My favorite ones are the “Quarantine series”:
During the lockdown in my city in Feb and March, I didn’t viz as much as usual. On one hand, I was busy working with my team remotely. Although WFH (work from home) is not a new experience for me, I have never had several 3-hour calls in a single day. On the other hand, I felt a lack of inspiration. I usually find my inspiration from the news. However, the news was all about coronavirus at that time. The numbers were growing up every day, and I was not in the mood to visualize them.
Judit’s quarantine series opened up a new world for me. Although unwillingly, I realized that lockdown was an opportunity to review my daily routine, to value all that I often take for granted, and to save two hours of commuting time each day and some transportation expenses! This series also inspired my entry into IronQuest — quantified self. Thank you, Judit for sharing your life and your thoughts!
Will Perkins (United States)

Twitter | LinkedIn | Blog or Website
As easy as it is to be down in the dumps this year (and believe me, it was easy), I look back at the relationships that I have made that keep me happy. As you hopefully already know, I am a happy/positive person. Even the most positive people have down days and I’m no exception. My wife and kid have kept my day to day full of love, happiness, and cheer, but there are relationships I’ve made throughout my time in the #DataFam that feel like friends I’ve known all my life. I can break my main interactions into a couple of groups: Game Night members and WhatsApp brain trust.
I feel like I might be breaking the first rule of game night (You don’t talk about Game Night), but I can’t resist. The Game Night members brought me in towards the beginning of the pandemic when there were game nights practically once a week. While I was almost always late to the party, I was still able to participate and enjoy connections beyond the data world with them. Game nights kind of fell by the wayside and it basically became a giant group chat. We would cheer each other up when one of us was down, share funny stories, and just engage on random levels. The group has varied its membership during these past 8 months, but it’s an honor getting to know everyone there.
The WhatsApp brain trust that I’ve been fortunate to be a part of is literally made of members throughout the world with Zen Masters, Ambassadors, COE leaders, featured authors, and all these other great minds… Then there’s me. The impostor. Or at least that’s what it seems like. I have been fortunate to stand on the shoulders of these giants who are happily holding my calves as I reach higher. There have been days where I literally wake up to over 200 messages of back and forth around design choices, client asks, use cases, what-if scenarios, and so on. It has become a wonderful sounding board for me to use whenever it comes to an idea or problem. Everyone is passionate about their role and craft but that also means it’s not always an echo chamber of high fives and “good job”. No one is afraid to challenge a bad idea or curious ask. No one is afraid to have the courage to be different. This gives me so much joy and fire to share that type of mindset within my organization. It’s invigorating!
In addition to those groups, I have gotten to know many out there on a more individual basis. I can’t name everyone but the people who stick out immediately are Fi Gordon, Vince Baumel, Zach Bowders, Nicole Lohr, Emily de Padua, Autumn Battani, and Steven Shoemaker. There have been countless more people that have had an individual impact on me and I can’t thank y’all enough for the impressions you’ve made. You make me smile every day with your energy, selflessness, and drive.
This is why I love the #DataFam!
Zach Bowders (United States)

Twitter | LinkedIn | Blog or Website
My love of and for the DataFam has expanded over the past year in no small part due to the conversations I’ve had as a part of starting the Data+Love podcast. Following TC19 I wanted to have more of the conversations I was having at the conference. Meeting people of diverse talents and perspectives that share a common love of data visualization. By creating an excuse to put me in those conversations bi-weekly I’ve made new friends, gained new insights, and only had my own passions encouraged and expanded. Make no mistake, without the DataFam, none of us would be writing on this blog. Many of our best visualizations (and visualizers) may not even exist! It’s the shared love of all of us coming together and creating a big tent that has made the DataFam what it is.
Zainab Ayodimeji (Nigeria)

Twitter | LinkedIn | Blog or Website
Sarah Bartlett. I’m part of a viz community in Nigeria and Sarah was invited to speak to us. At the end of her talk, she gave us feedback on vizzes we had been told to prepare beforehand.
It was not a lot of comments but it certainly opened my eyes to the capabilities of Tableau, the following Friday she gave me a #TableauFF mention and that was my official entry into the datafam community.
These acts, which would seem like a simple gesture have gone a long way for me, made me feel comfortable & welcomed in a global community, increased confidence in my skills, and also made me not afraid to share my work.
Since then I have participated in every makeover Monday, became a public ambassador, had my viz featured in viz gallery, and met so many more wonderful people in the community. Sarah’s feedback changed my life.
The other person I want to acknowledge is Abisola Oni, she started the first viz community in Nigeria and this community forms the foundation of my viz journey, it was this community that led me to tableau and I’m forever grateful for that.
Lastly, the entire “cast and crew” of #makeovermonday, from Eva, Charlie, Andy to the weekly participants. They have been really key to my growth and I’m giving everybody one big hug with this mention.
Zak Geis (United States)

There are so many people in our datafam that inspire me, give me hope, and make me smile, so it took me some time to decide who I should mention. My pick though would have to be Emily Kund. Emily embodies the positivity of the Tableau community and does so much to bring us together. This year alone, she leads the DataFamCommunityJam, which gave us something new `to look forward to during a tough year. It helped us to meet new people, learn new things, and break away from the trappings of 2020. Outside of this new event, she continued the other impactful events/projects she does including the Fringe Festivals, the Tableau Wannabe Podcast, and even hosted the #DataNightIn for Tableau Conference-ish. One of the biggest things that inspire me about Emily is that she never seems to do these things or organize these events for recognition. She just likes to do it. I feel thankful for Emily and everything she has done for our community and I know that we’re a better group of people because of her. Thanks for all you do Emily!
Thank you for reading. Please share with anyone who uses Tableau and isn’t part of or aware there is a rich community of people all over the world waiting to befriend them and help them grow with the tool and making an impact with data.

Adam’s viz note: The community wanted a viz on the blog. Unfortunately, Priya and I did not have time, but we could count on the community to come through. Over the past couple days, Stephen shared his budding viz on our blog combining the power of R and Tableau to extract word counts, words, word roots, and sentiment analysis to something very cool. Thank you so much Stephen — this is great! Here’s another link to the viz.